Reporting and Dashboard

Fulfillment Solution

Reporting and Dashboard

Summarizing Operations to Drive Your Business Growth
The importance of sales performance summaries for online stores cannot be understated. Such reports help businesses, large or small, plan effectively for future growth, reduce costs, and increase profits. Additionally, it provides comprehensive data that can fully support your business operations.

Our dashboard aggregates data into a single page, with regularly updated information that helps businesses make fast decisions. MyCloud’s dashboards boost sales directly by increasing revenue and profits, and indirectly by reflecting the efficiency of order management via Fulfillment Dashboards, as well as showing which products should be restocked or cleared out through Inventory Dashboards.

MyCloud Fulfillment Offers Two Types of Reporting

Our dashboard aggregates data into a single page, with regularly updated information that helps businesses make fast decisions. MyCloud’s dashboards boost sales directly by increasing revenue and profits, and indirectly by reflecting the efficiency of order management via Fulfillment Dashboards, as well as showing which products should be restocked or cleared out through Inventory Dashboards.

Sales Dashboard

Real-Time Fulfillment

Fulfillment Dashboard

Inventory Dashboard

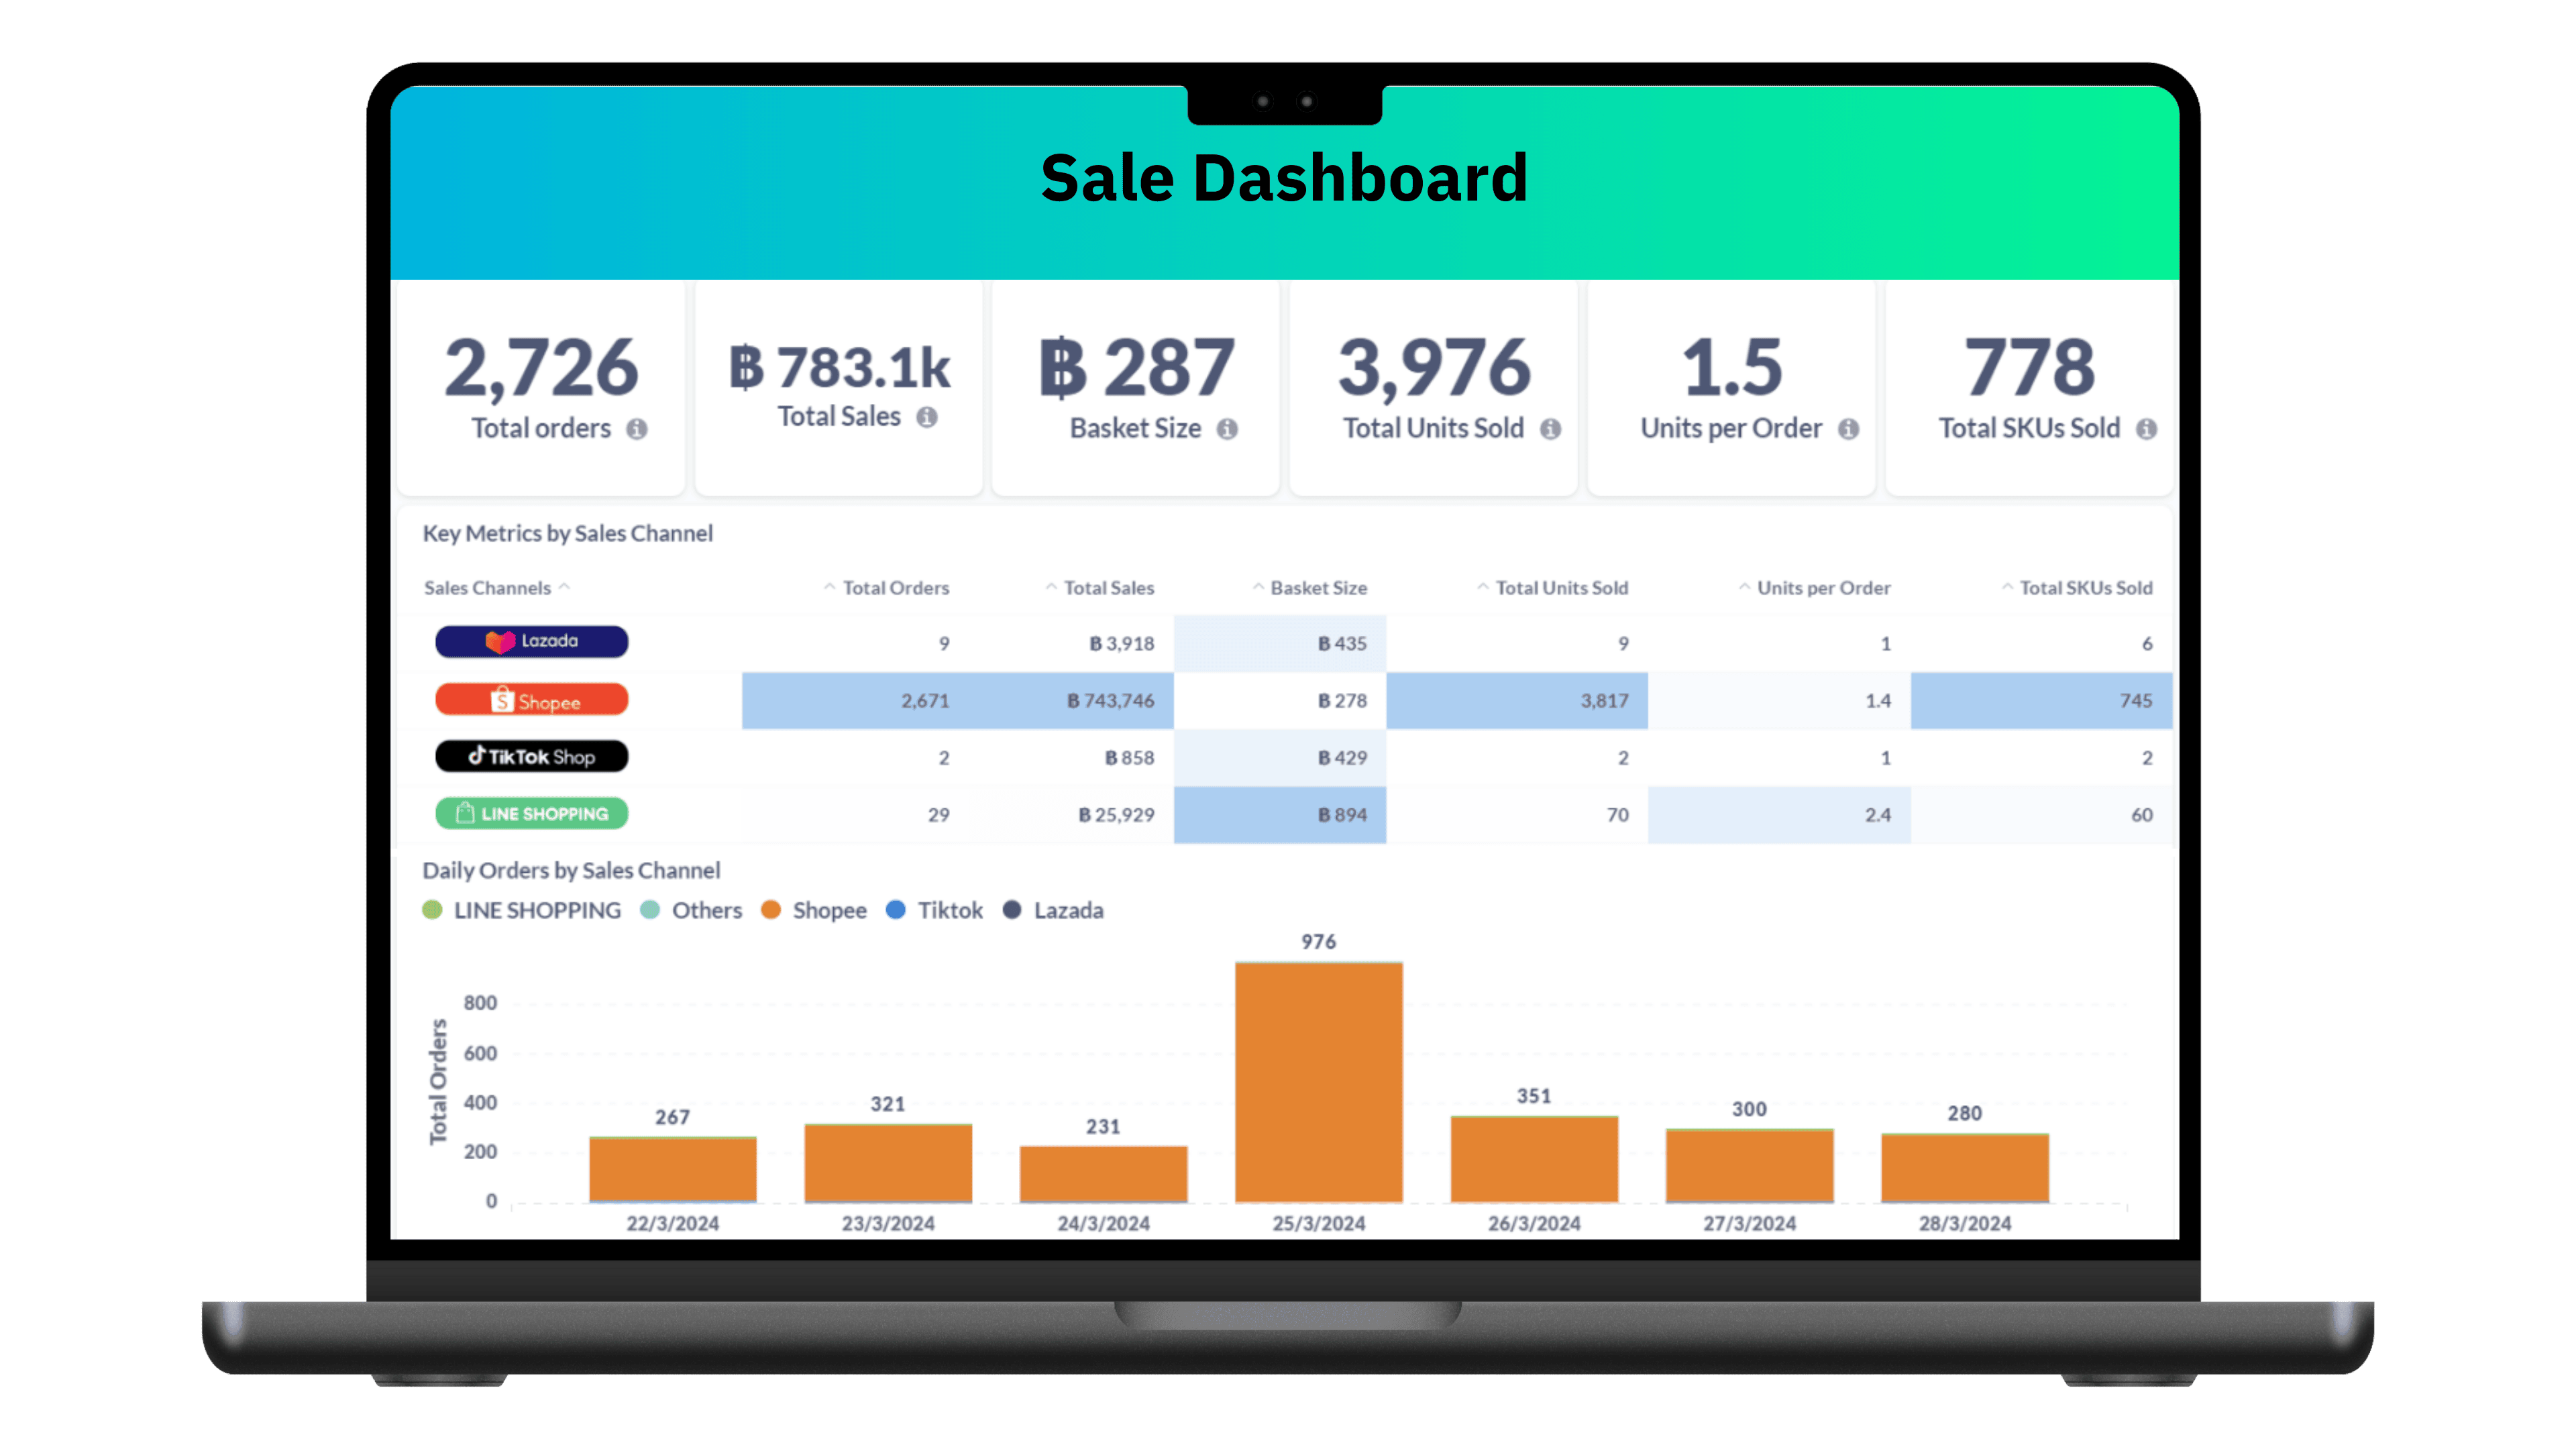
Sales Dashboard: Sales Summary by Channel

Sales summaries during each period help you directly track and understand your sales performance. You can compare current sales with previous rounds to identify trends more easily. Additionally, you can track factors affecting your sales to plan more effectively.

What were the total sales during the last period?

How were the daily sales during the last period?

Which channel sold the most?

What time of day generated the highest sales?

Image of Sales Dashboard: Sales Summary by Channel

Real-Time Fulfillment Dashboard: Snapshot of Current Orders

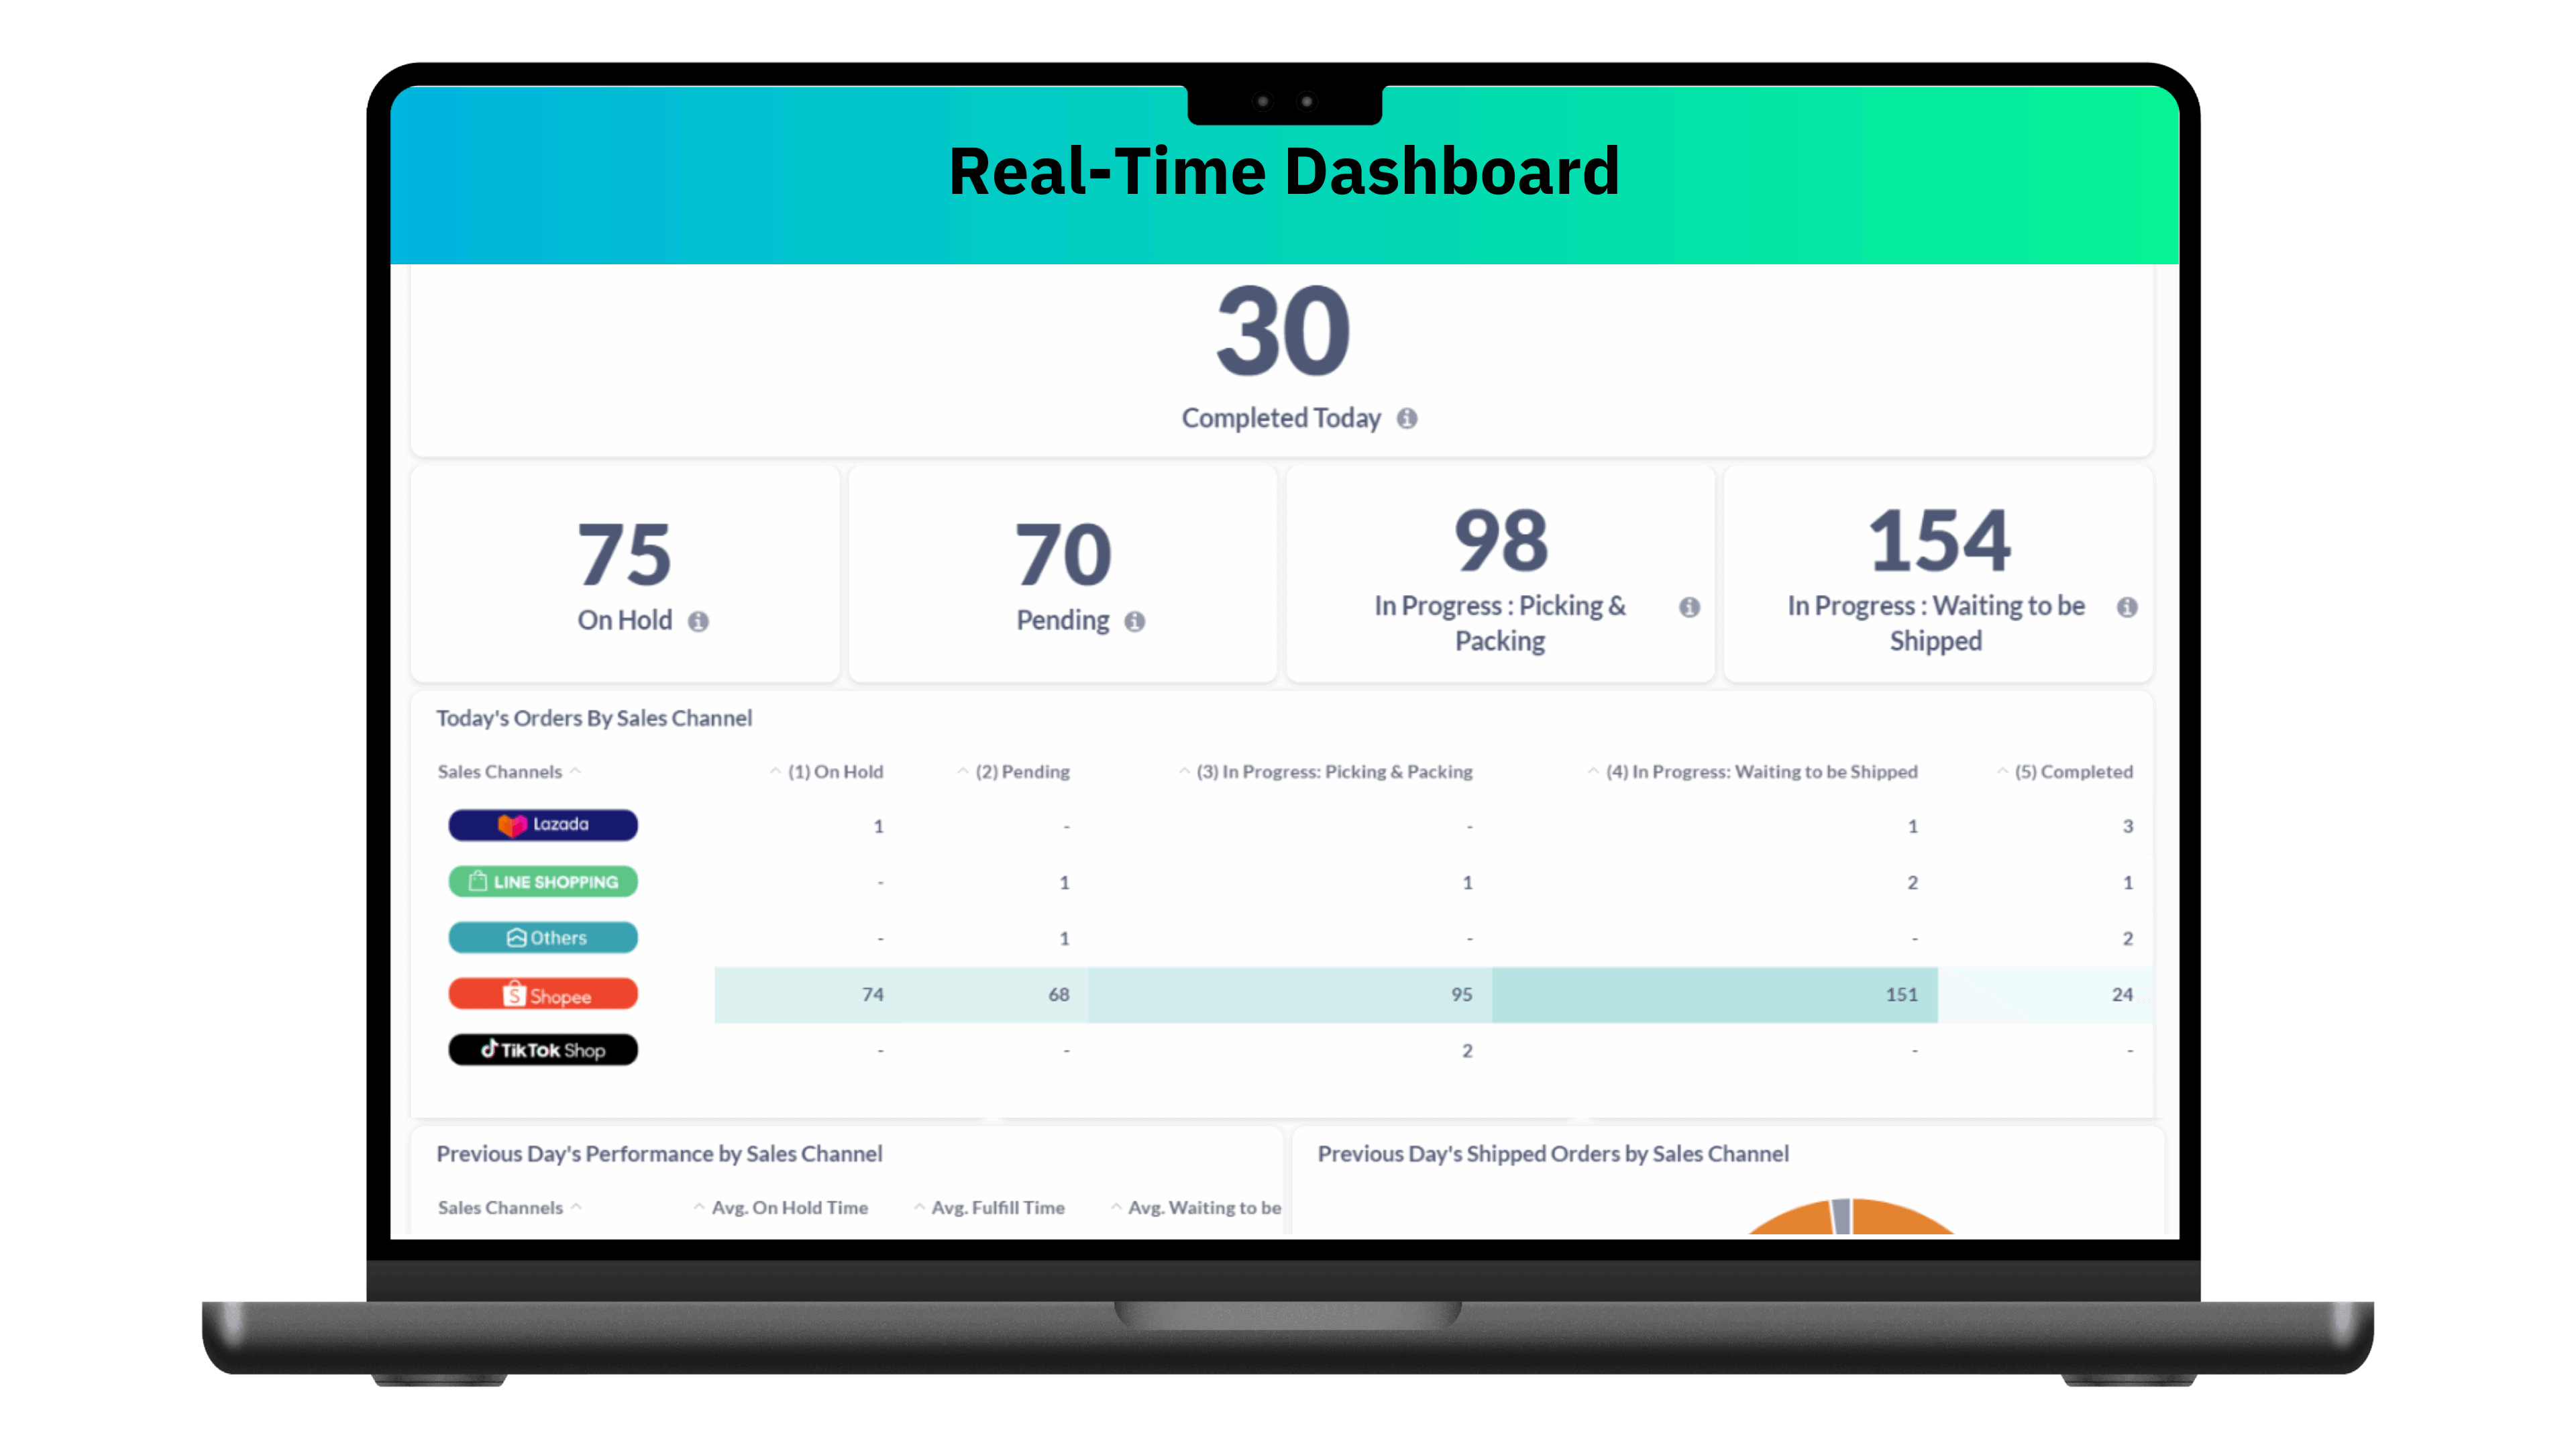
The Real-Time Fulfillment Dashboard summarizes the current order status, breaking down data by sales channels and tracking the time taken to pack orders. This helps you visualize the overall order status and ensures smooth sales operations.

What is the current status of most orders?

How long does it take to pack an order?

Which channel processes orders the fastest?

How long does it take for the courier to collect shipments?

Image of Real-Time Fulfillment Dashboard: Snapshot of Current Orders

Fulfillment Dashboard: Evaluating Management Efficiency

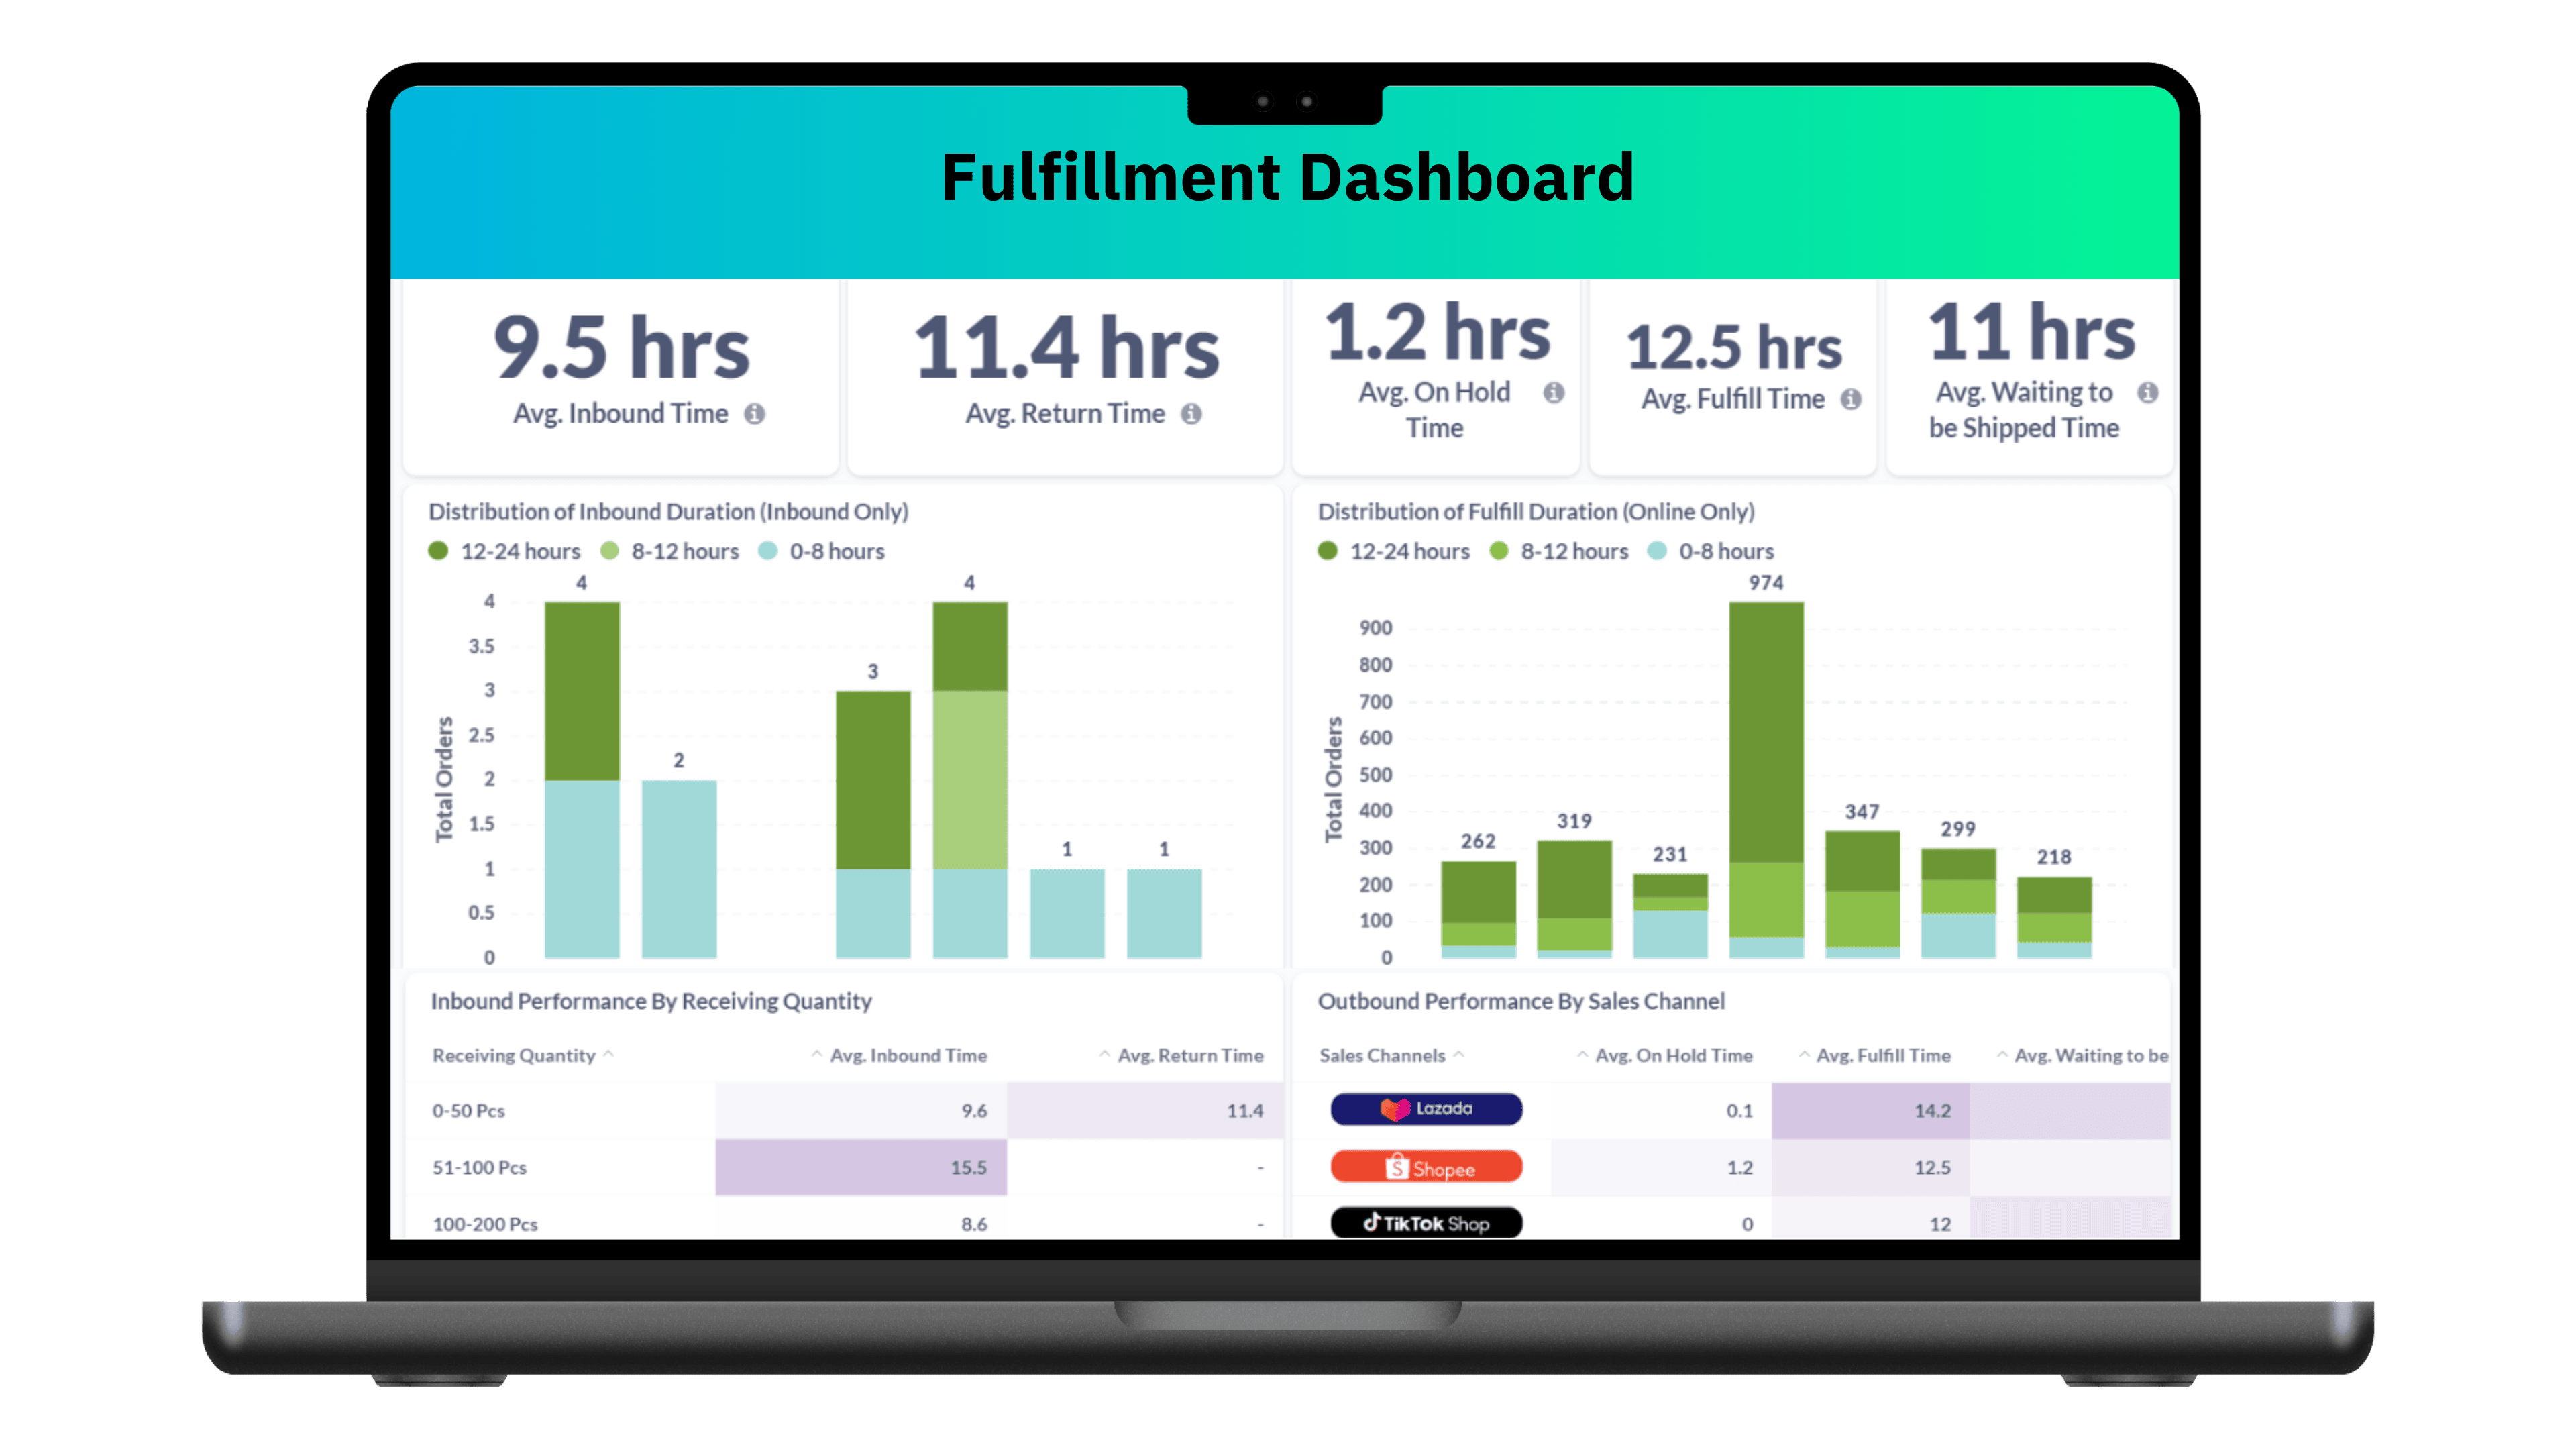
The Fulfillment Dashboard manages SLA and indirectly helps increase sales by monitoring packing statistics. Real-time insights help manage ongoing orders more efficiently, offering a systematic way to review various stages of work.

What is the average time taken to receive inventory?

How long did it take to pack and ship on days with order spikes?

What is the total time taken to process all orders?

How many orders are pending, and what are their statuses?

Image of Fulfillment Dashboard: Evaluating Management Efficiency

Inventory Dashboard: Stock Summary to Boost Sales Opportunities

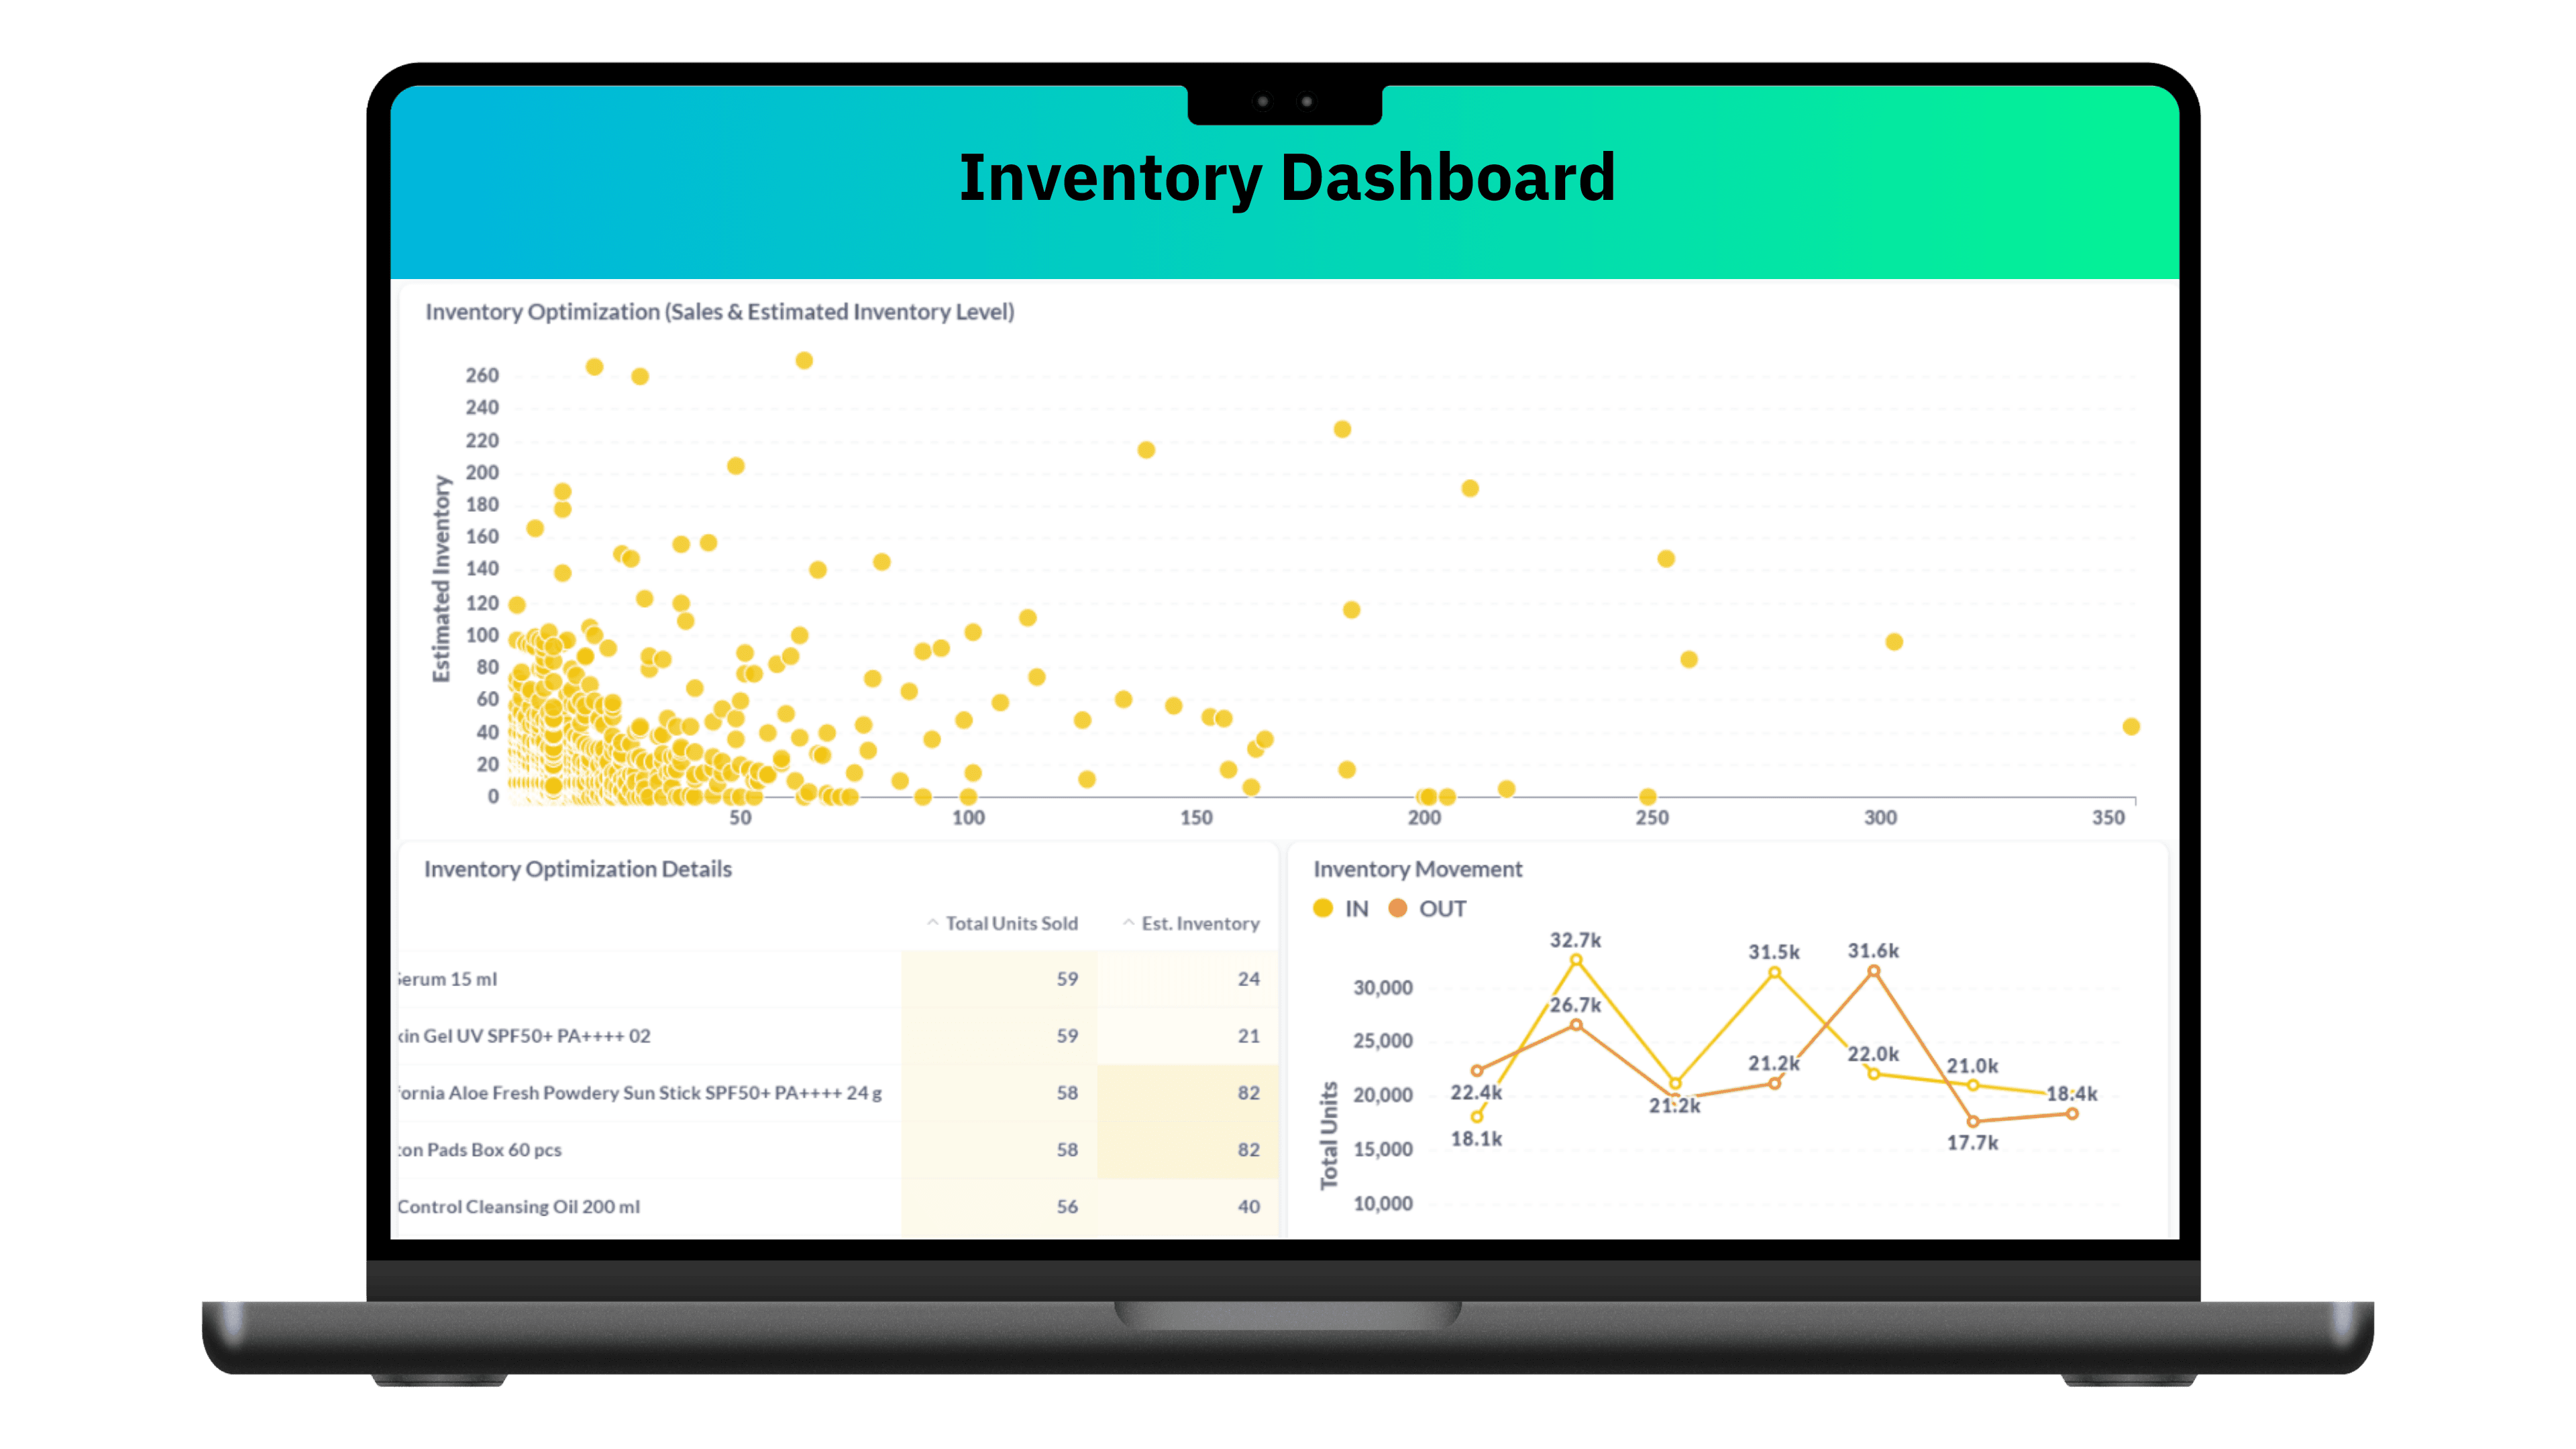
Inventory management helps reduce storage costs, such as identifying hard-to-sell items that take up unnecessary space or ensuring that best-selling products are adequately stocked. The data is presented in easy-to-understand graphs for quick analysis.

Best-selling items are running low—need to restock soon.

Overview of SKUs—which items should be restocked, and which should be cleared?

Poor-selling items might need stock reductions.

Which SKUs take up too much space or have been stored for too long?

Image of Inventory Dashboard: Stock Summary to Boost Sales Opportunities
Sales Dashboard

Sales Dashboard: Sales Summary by Channel

Image of Sales Dashboard: Sales Summary by Channel

Sales summaries during each period help you directly track and understand your sales performance. You can compare current sales with previous rounds to identify trends more easily. Additionally, you can track factors affecting your sales to plan more effectively.

What were the total sales during the last period?

How were the daily sales during the last period?

Which channel sold the most?

What time of day generated the highest sales?

Real-Time Fulfillment

Real-Time Fulfillment Dashboard: Snapshot of Current Orders

Image of Real-Time Fulfillment Dashboard: Snapshot of Current Orders

The Real-Time Fulfillment Dashboard summarizes the current order status, breaking down data by sales channels and tracking the time taken to pack orders. This helps you visualize the overall order status and ensures smooth sales operations.

What is the current status of most orders?

How long does it take to pack an order?

Which channel processes orders the fastest?

How long does it take for the courier to collect shipments?

Fulfillment Dashboard

Fulfillment Dashboard: Evaluating Management Efficiency

Image of Fulfillment Dashboard: Evaluating Management Efficiency

The Fulfillment Dashboard manages SLA and indirectly helps increase sales by monitoring packing statistics. Real-time insights help manage ongoing orders more efficiently, offering a systematic way to review various stages of work.

What is the average time taken to receive inventory?

How long did it take to pack and ship on days with order spikes?

What is the total time taken to process all orders?

How many orders are pending, and what are their statuses?

Inventory Dashboard

Inventory Dashboard: Stock Summary to Boost Sales Opportunities

Image of Inventory Dashboard: Stock Summary to Boost Sales Opportunities

Inventory management helps reduce storage costs, such as identifying hard-to-sell items that take up unnecessary space or ensuring that best-selling products are adequately stocked. The data is presented in easy-to-understand graphs for quick analysis.

Best-selling items are running low—need to restock soon.

Overview of SKUs—which items should be restocked, and which should be cleared?

Poor-selling items might need stock reductions.

Which SKUs take up too much space or have been stored for too long?

In addition to dashboards that improve your business’s efficiency and growth, MyCloud Fulfillment also offers Reporting Services that summarize all activities and expenses into easy-to-understand numbers. These help support your business’s planning efforts for the best possible outcomes.

Reporting: Easy Data Management in One Click

Reports are summarized to help you predict each step more conveniently, divided into the following categories:
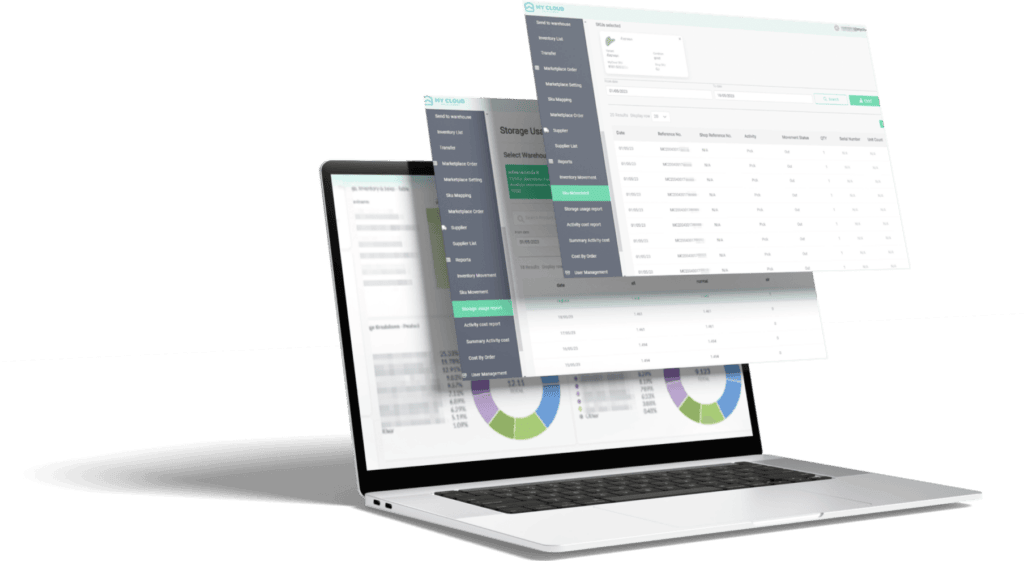
Storage Usage Reports

Summary Activity Cost Reports

Inventory Movement Reports  

SKU Movement Reports    

Activity Cost Report  

Cost By Order Reports  
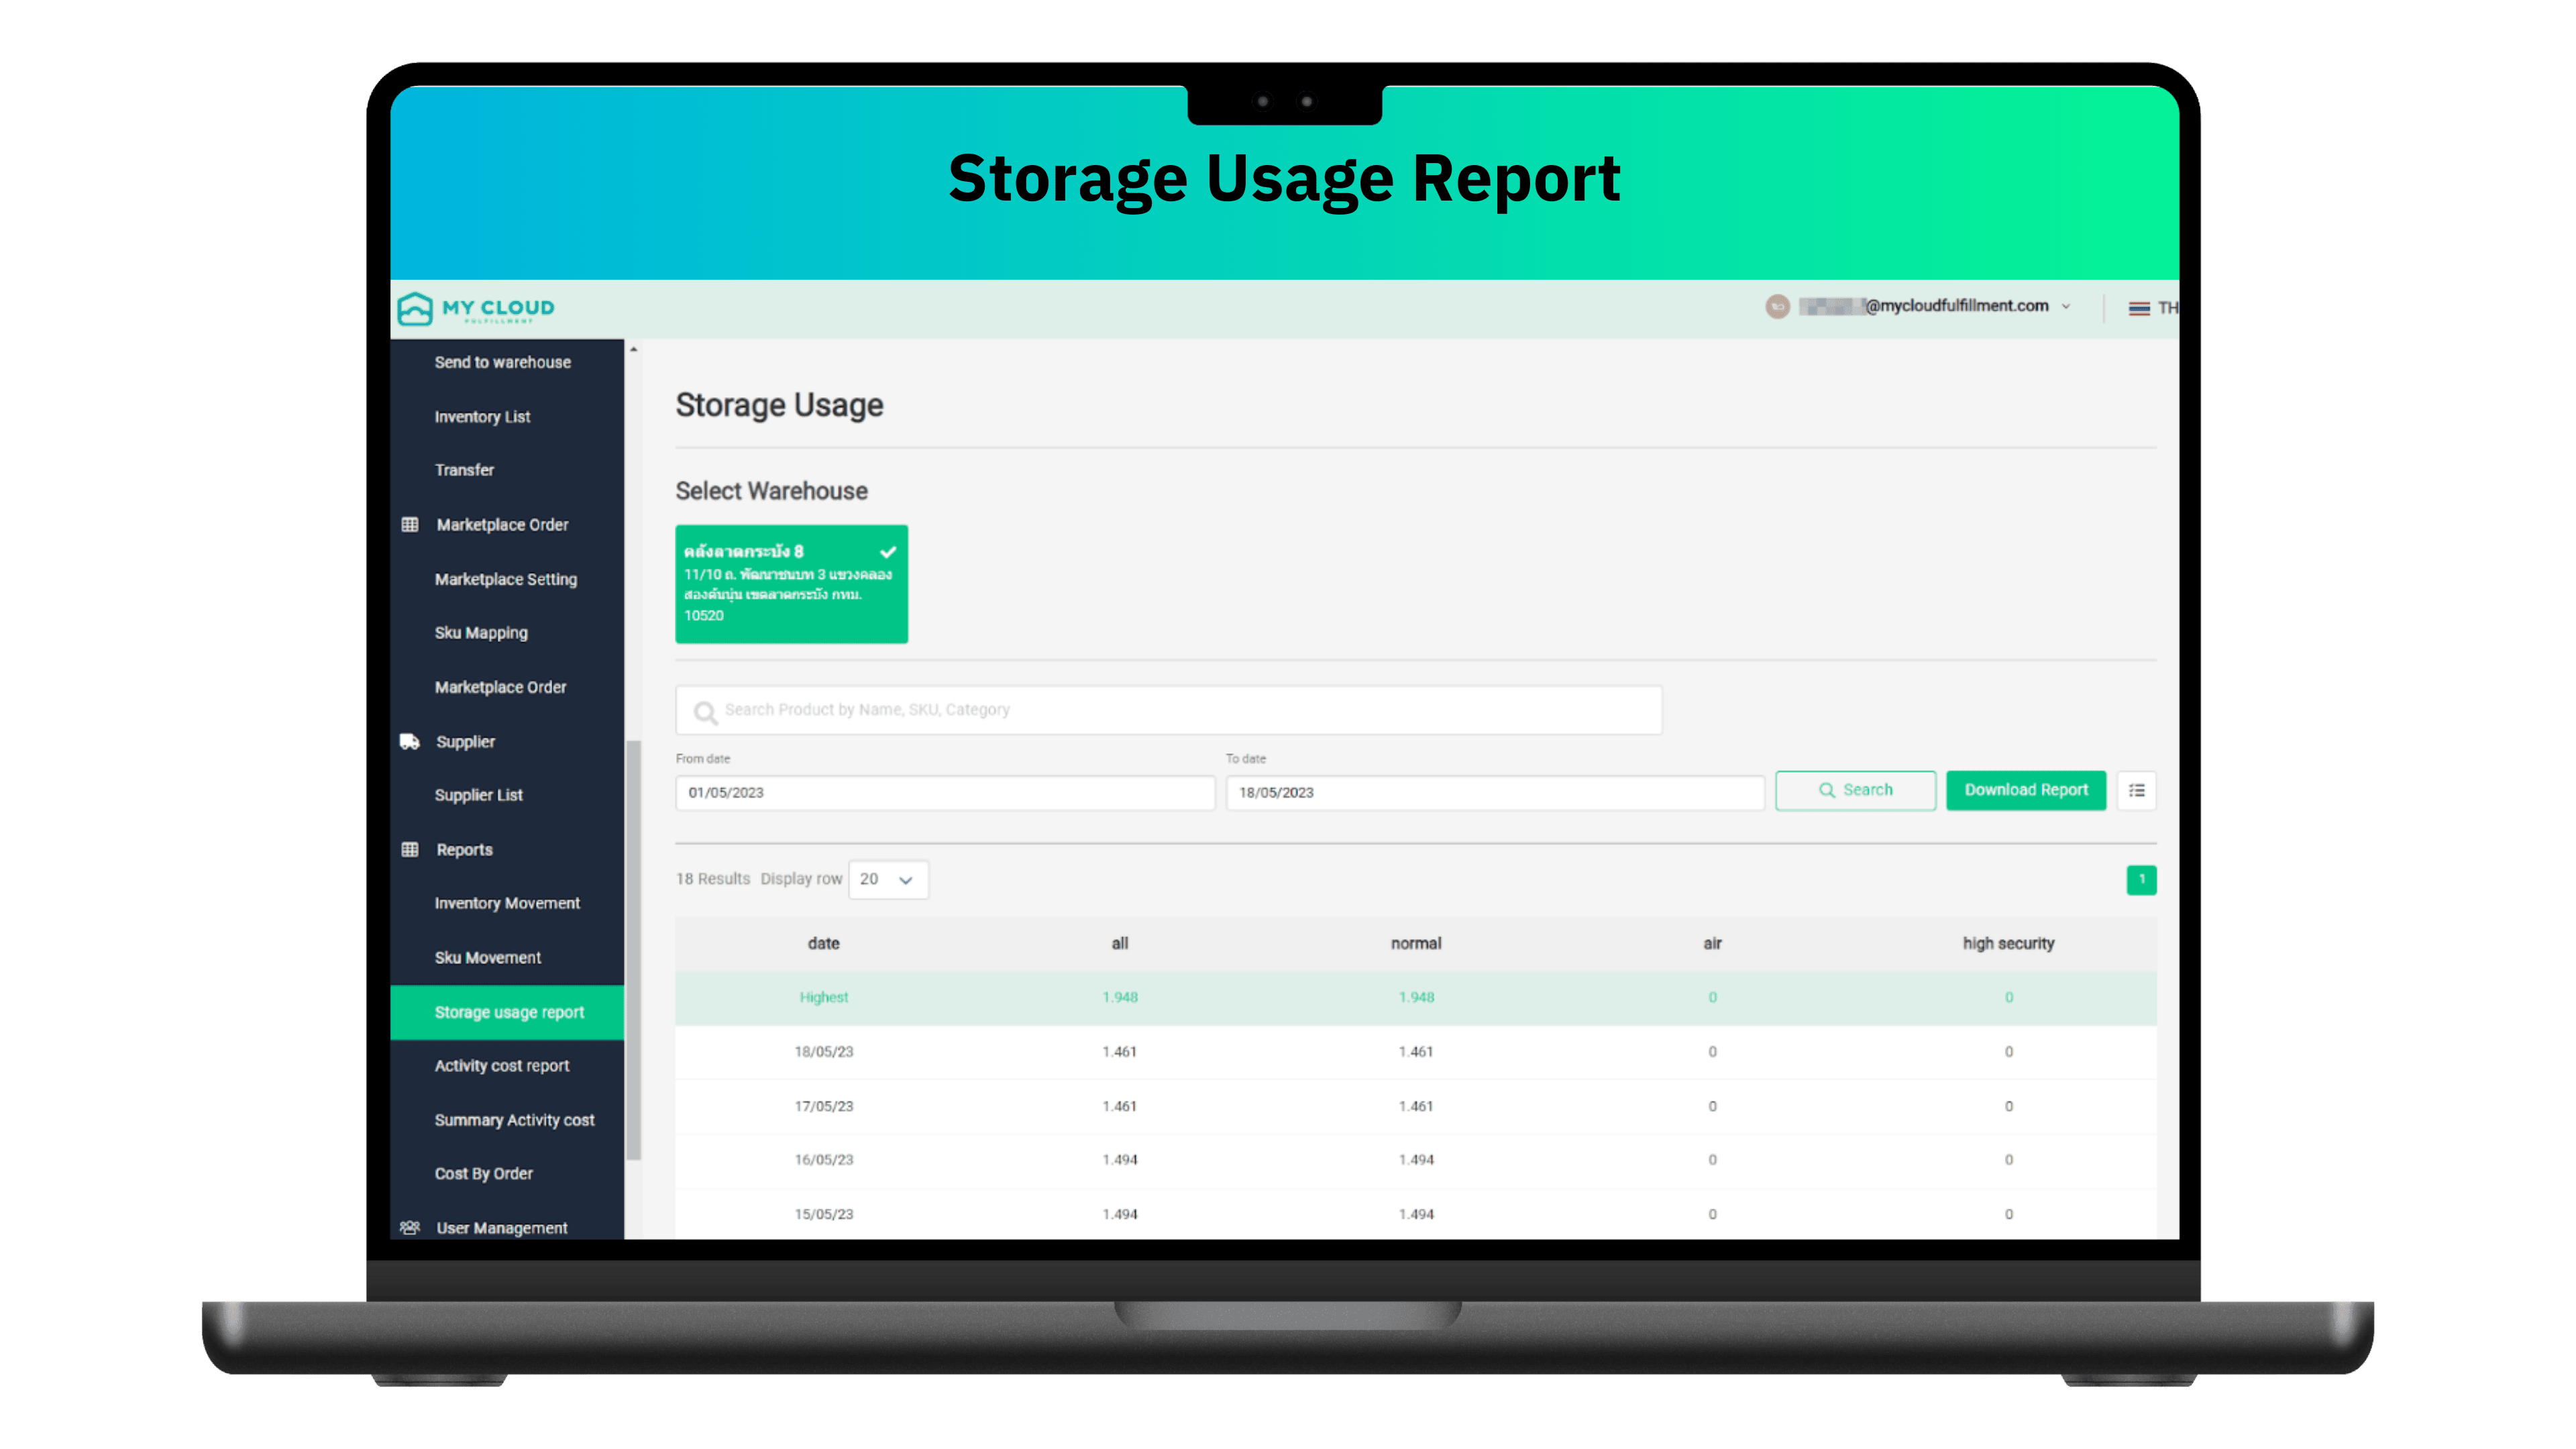
This report summarizes warehouse space usage, including the storage format and daily updates, allowing stores to evaluate their space utilization and plan effectively.
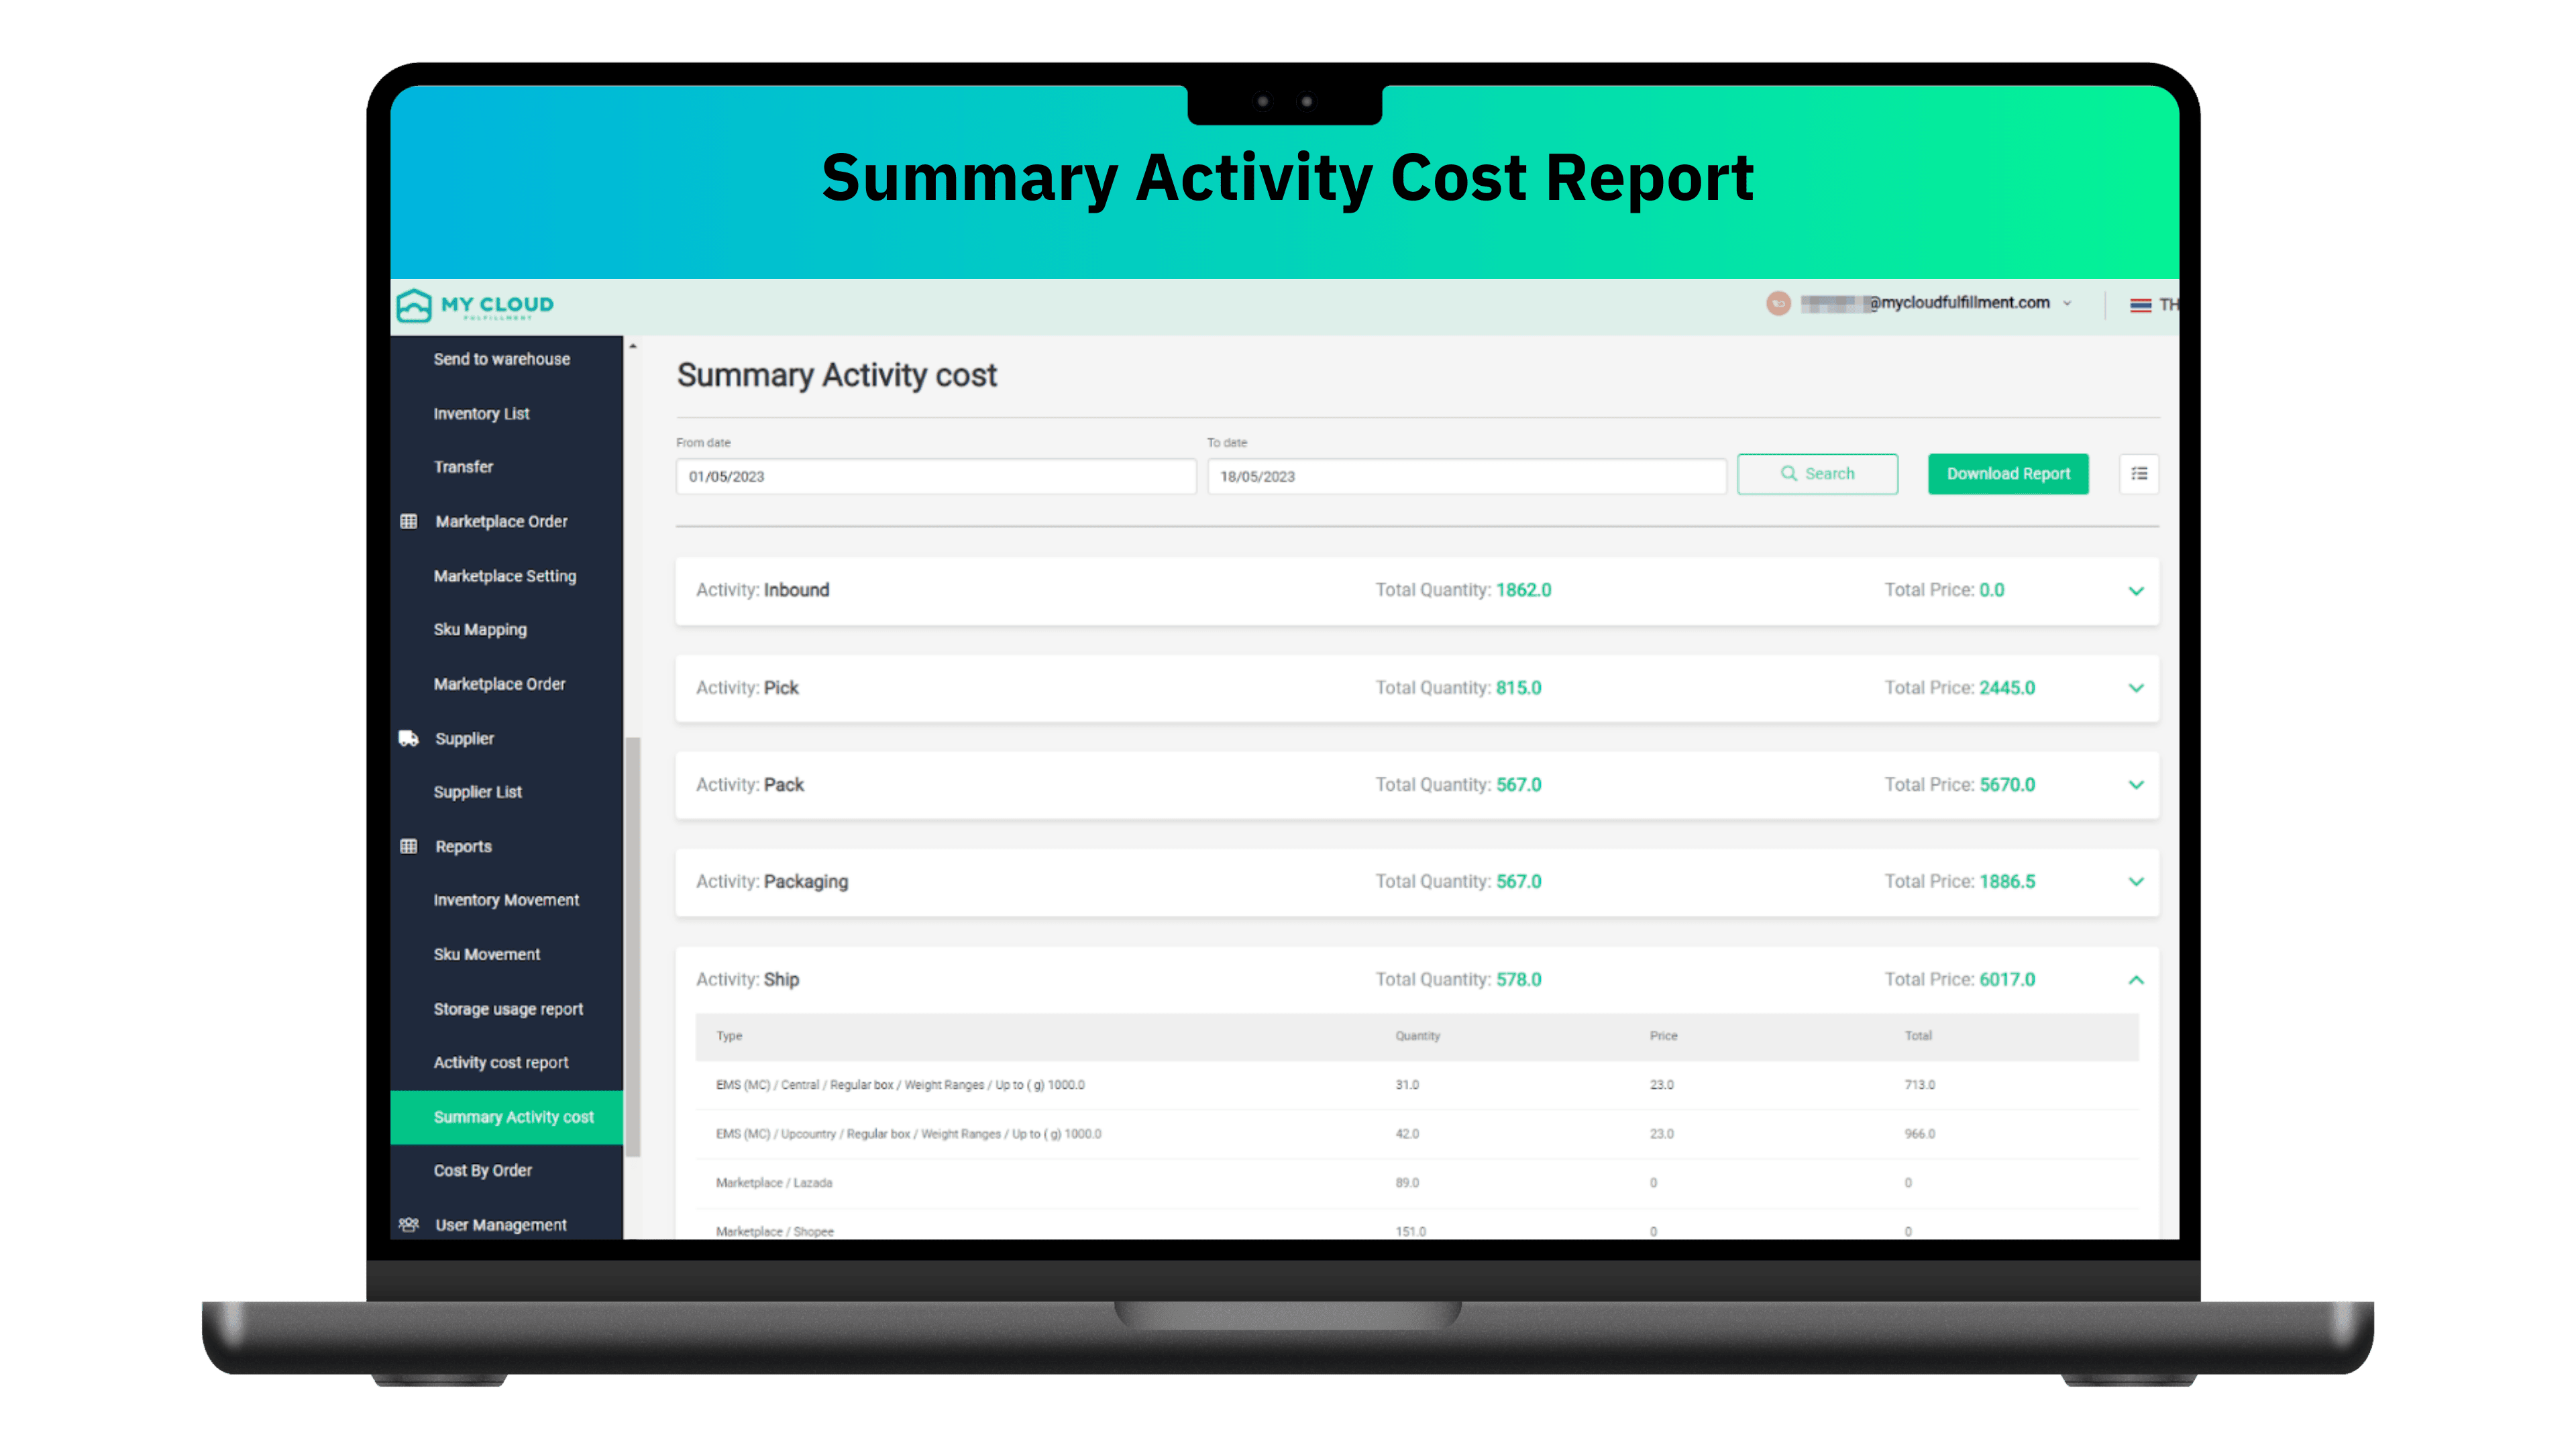
This report summarizes all costs incurred during different processes, including receiving, picking, packing, etc., enabling stores to evaluate whether their expenses align with their operations.
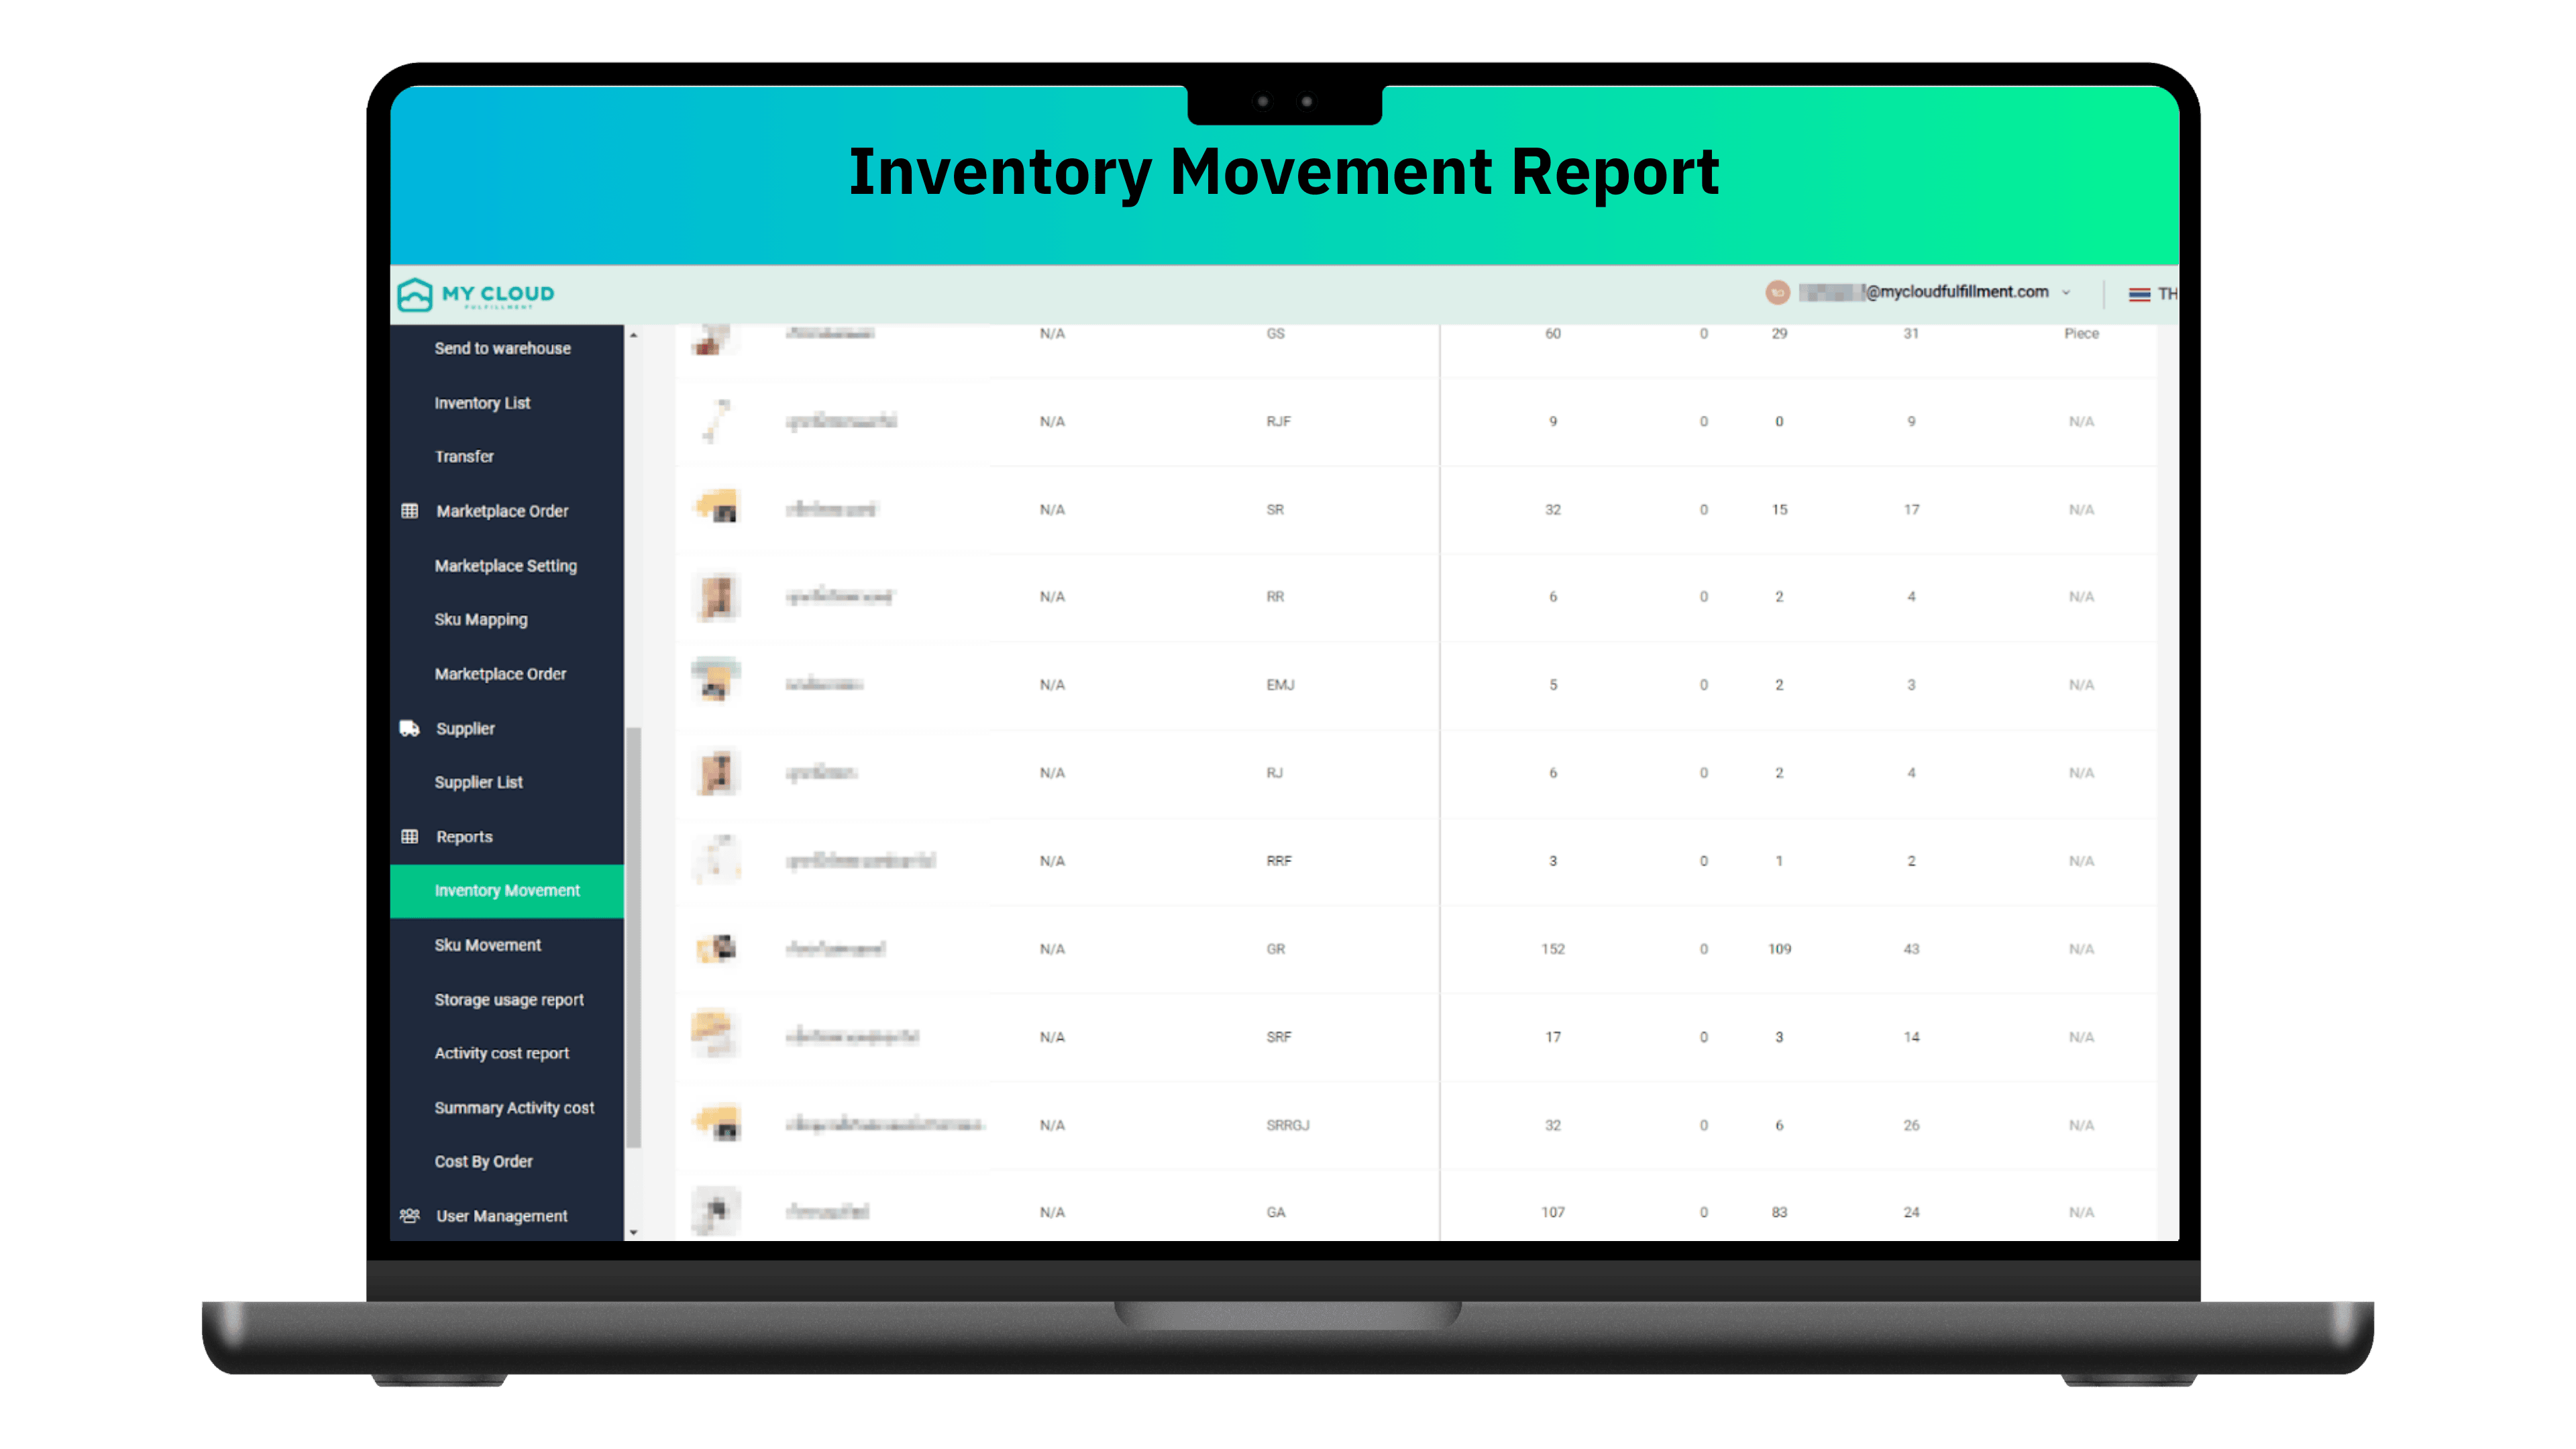
This report provides an overview of all inventory movements, including receiving dates, additions or reductions (e.g., restocking or returns, shipments), and the latest balance.
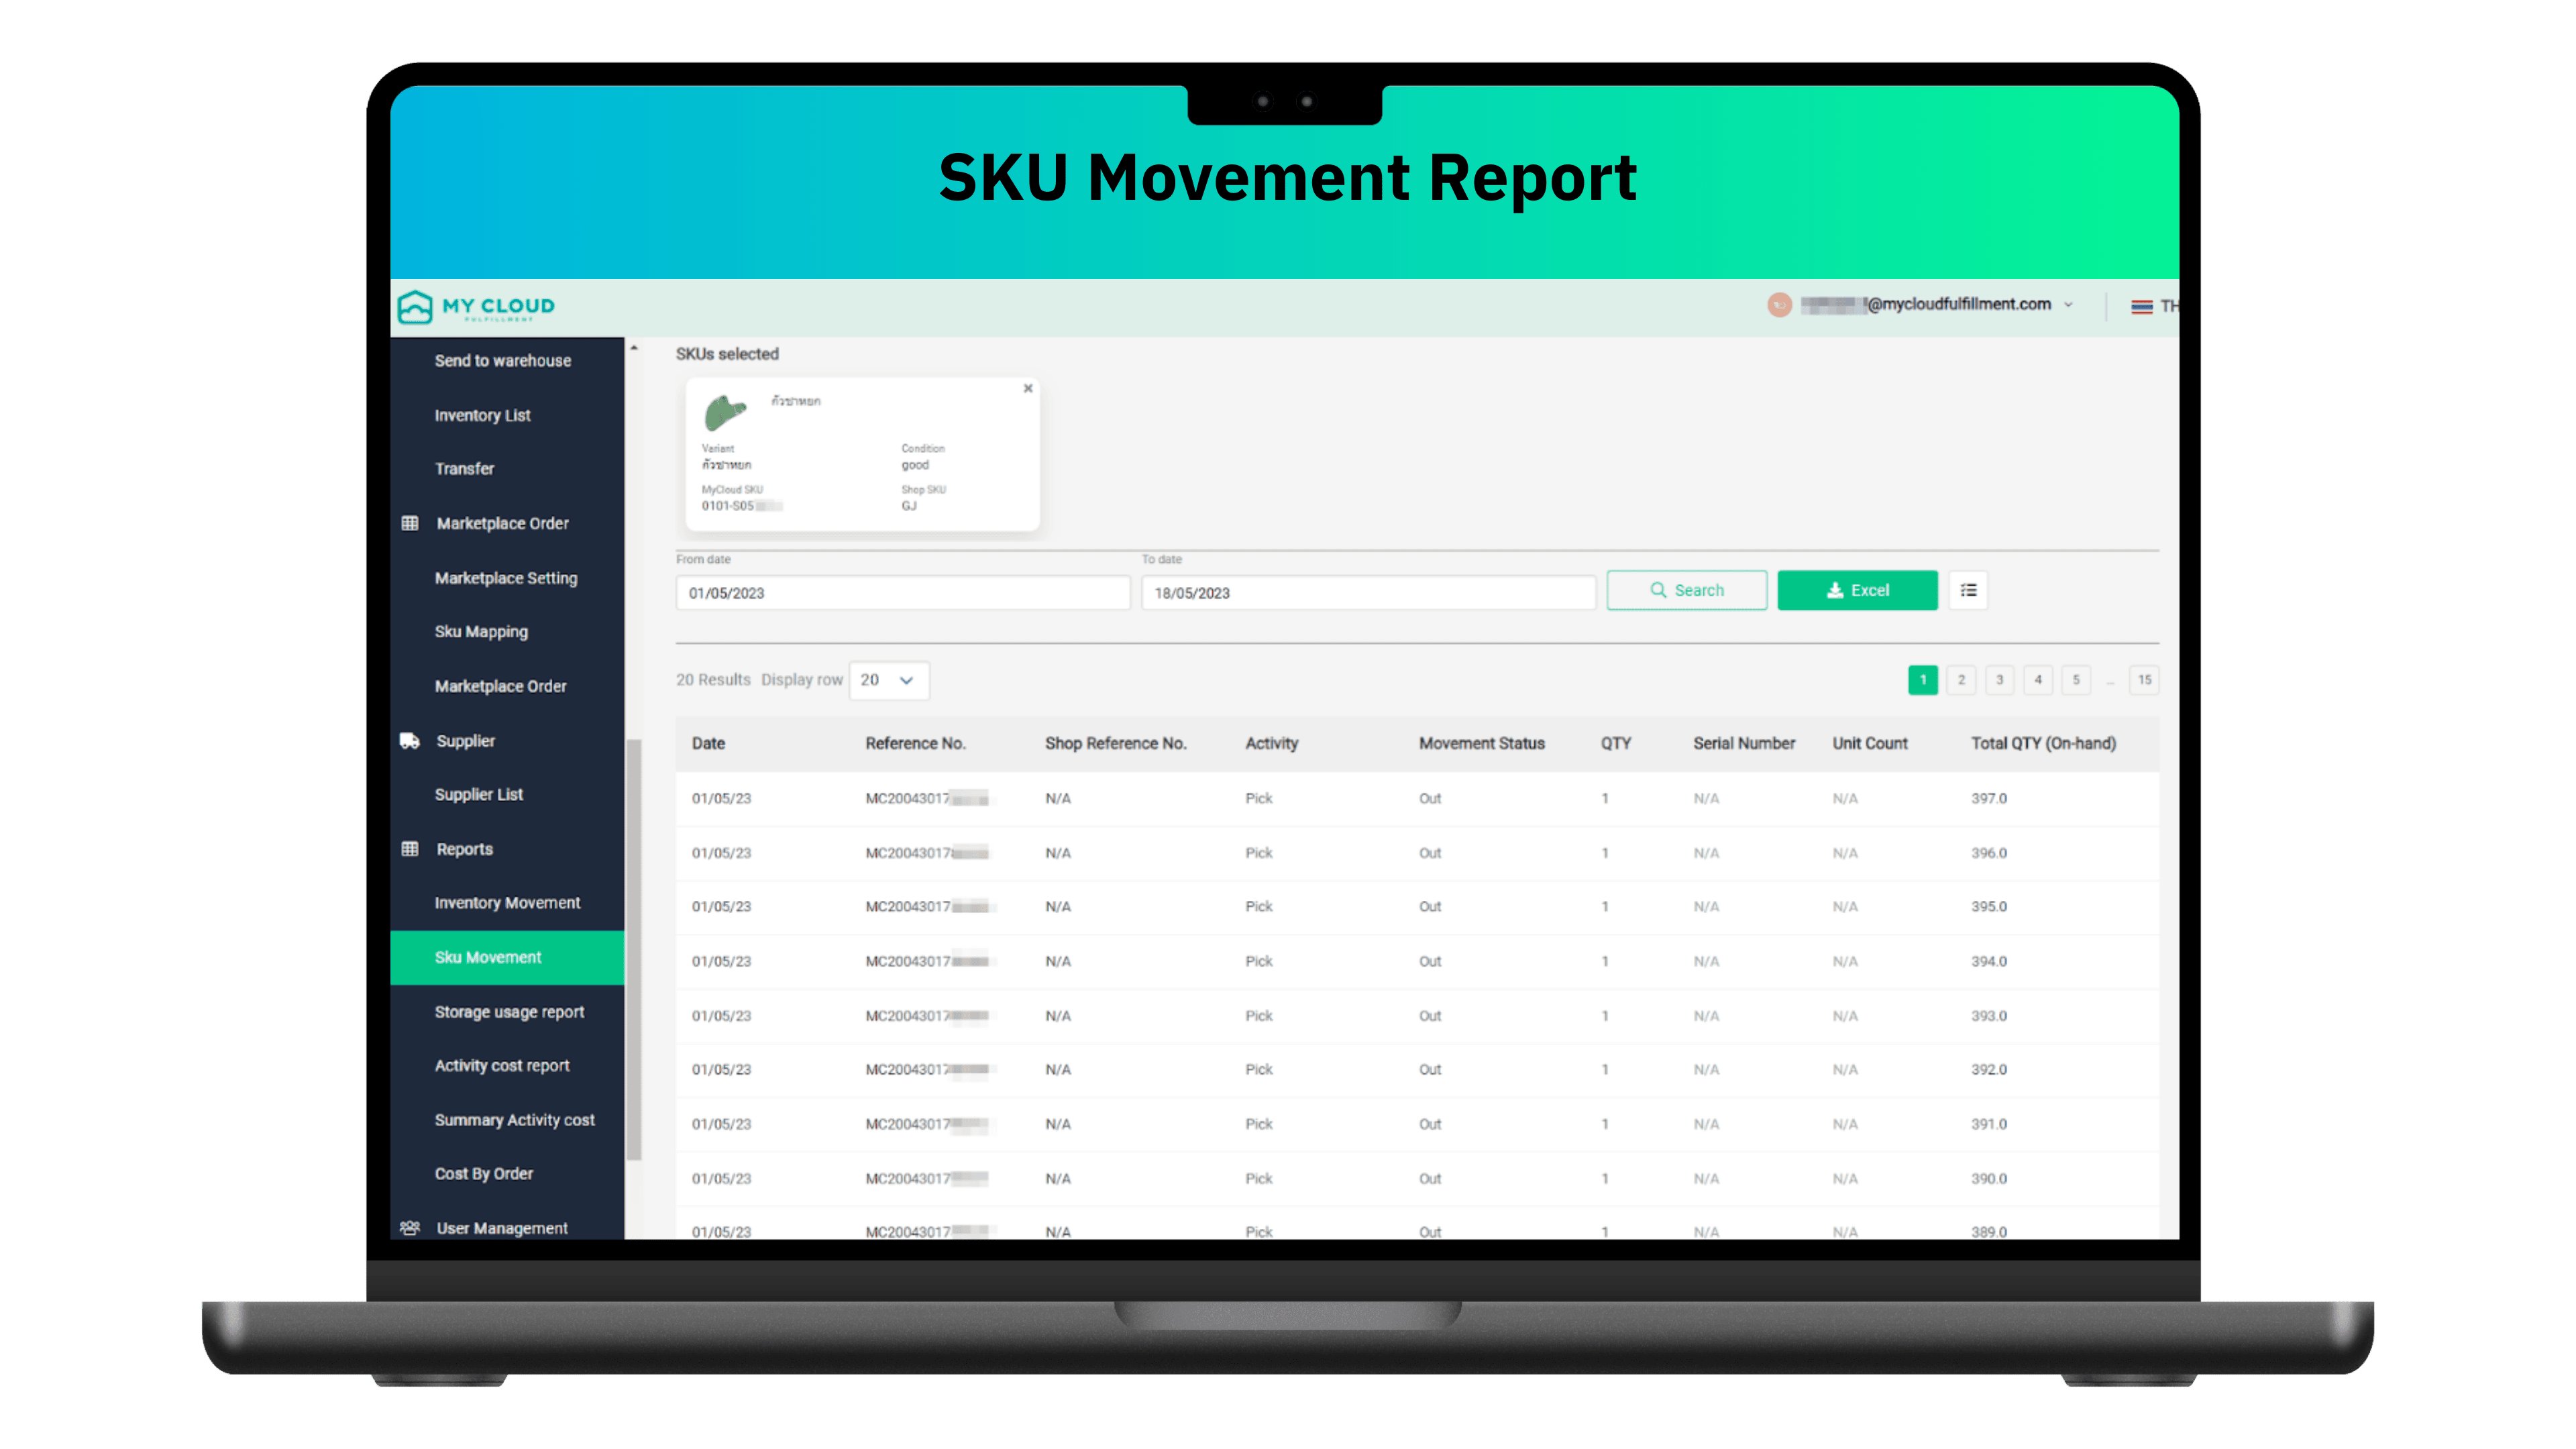
The SKU Movement Report provides detailed insights into the movement of individual SKUs, explaining reasons for additions or removals and including information on which stage of processing the product is currently at.
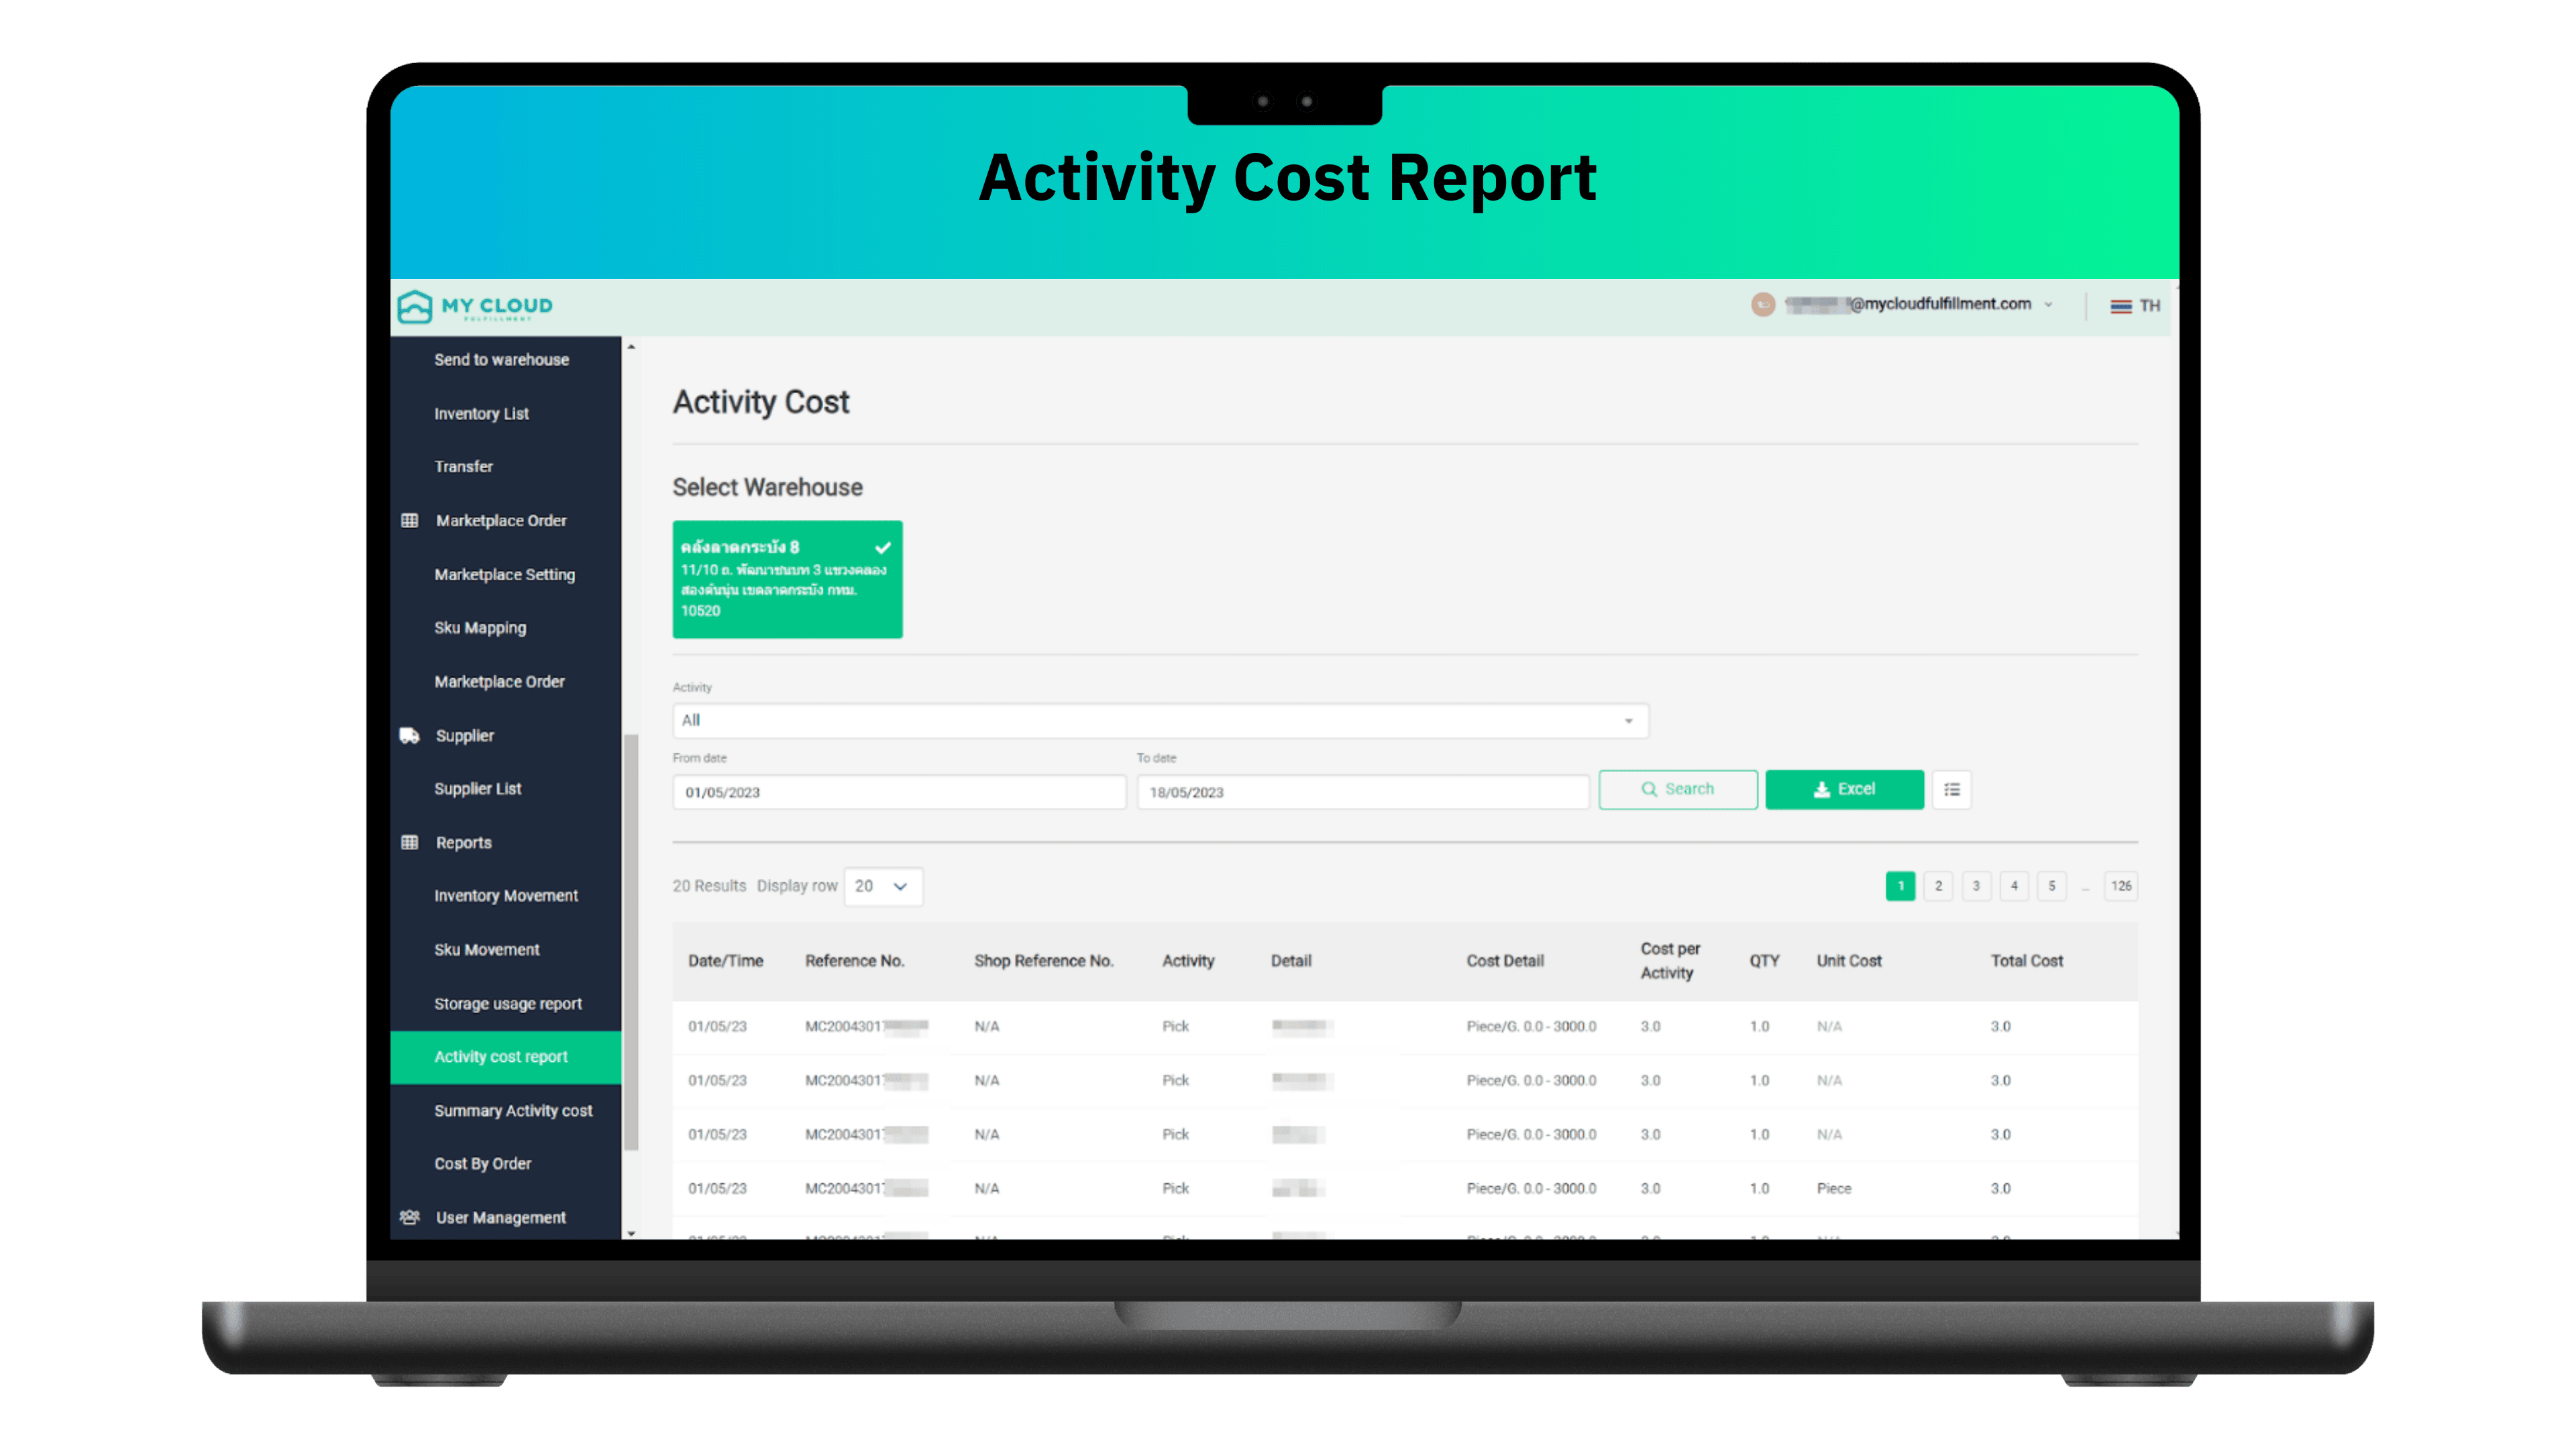
This report provides detailed expenses by activity or order, breaking down the costs of picking, packing, or other activities related to each order.
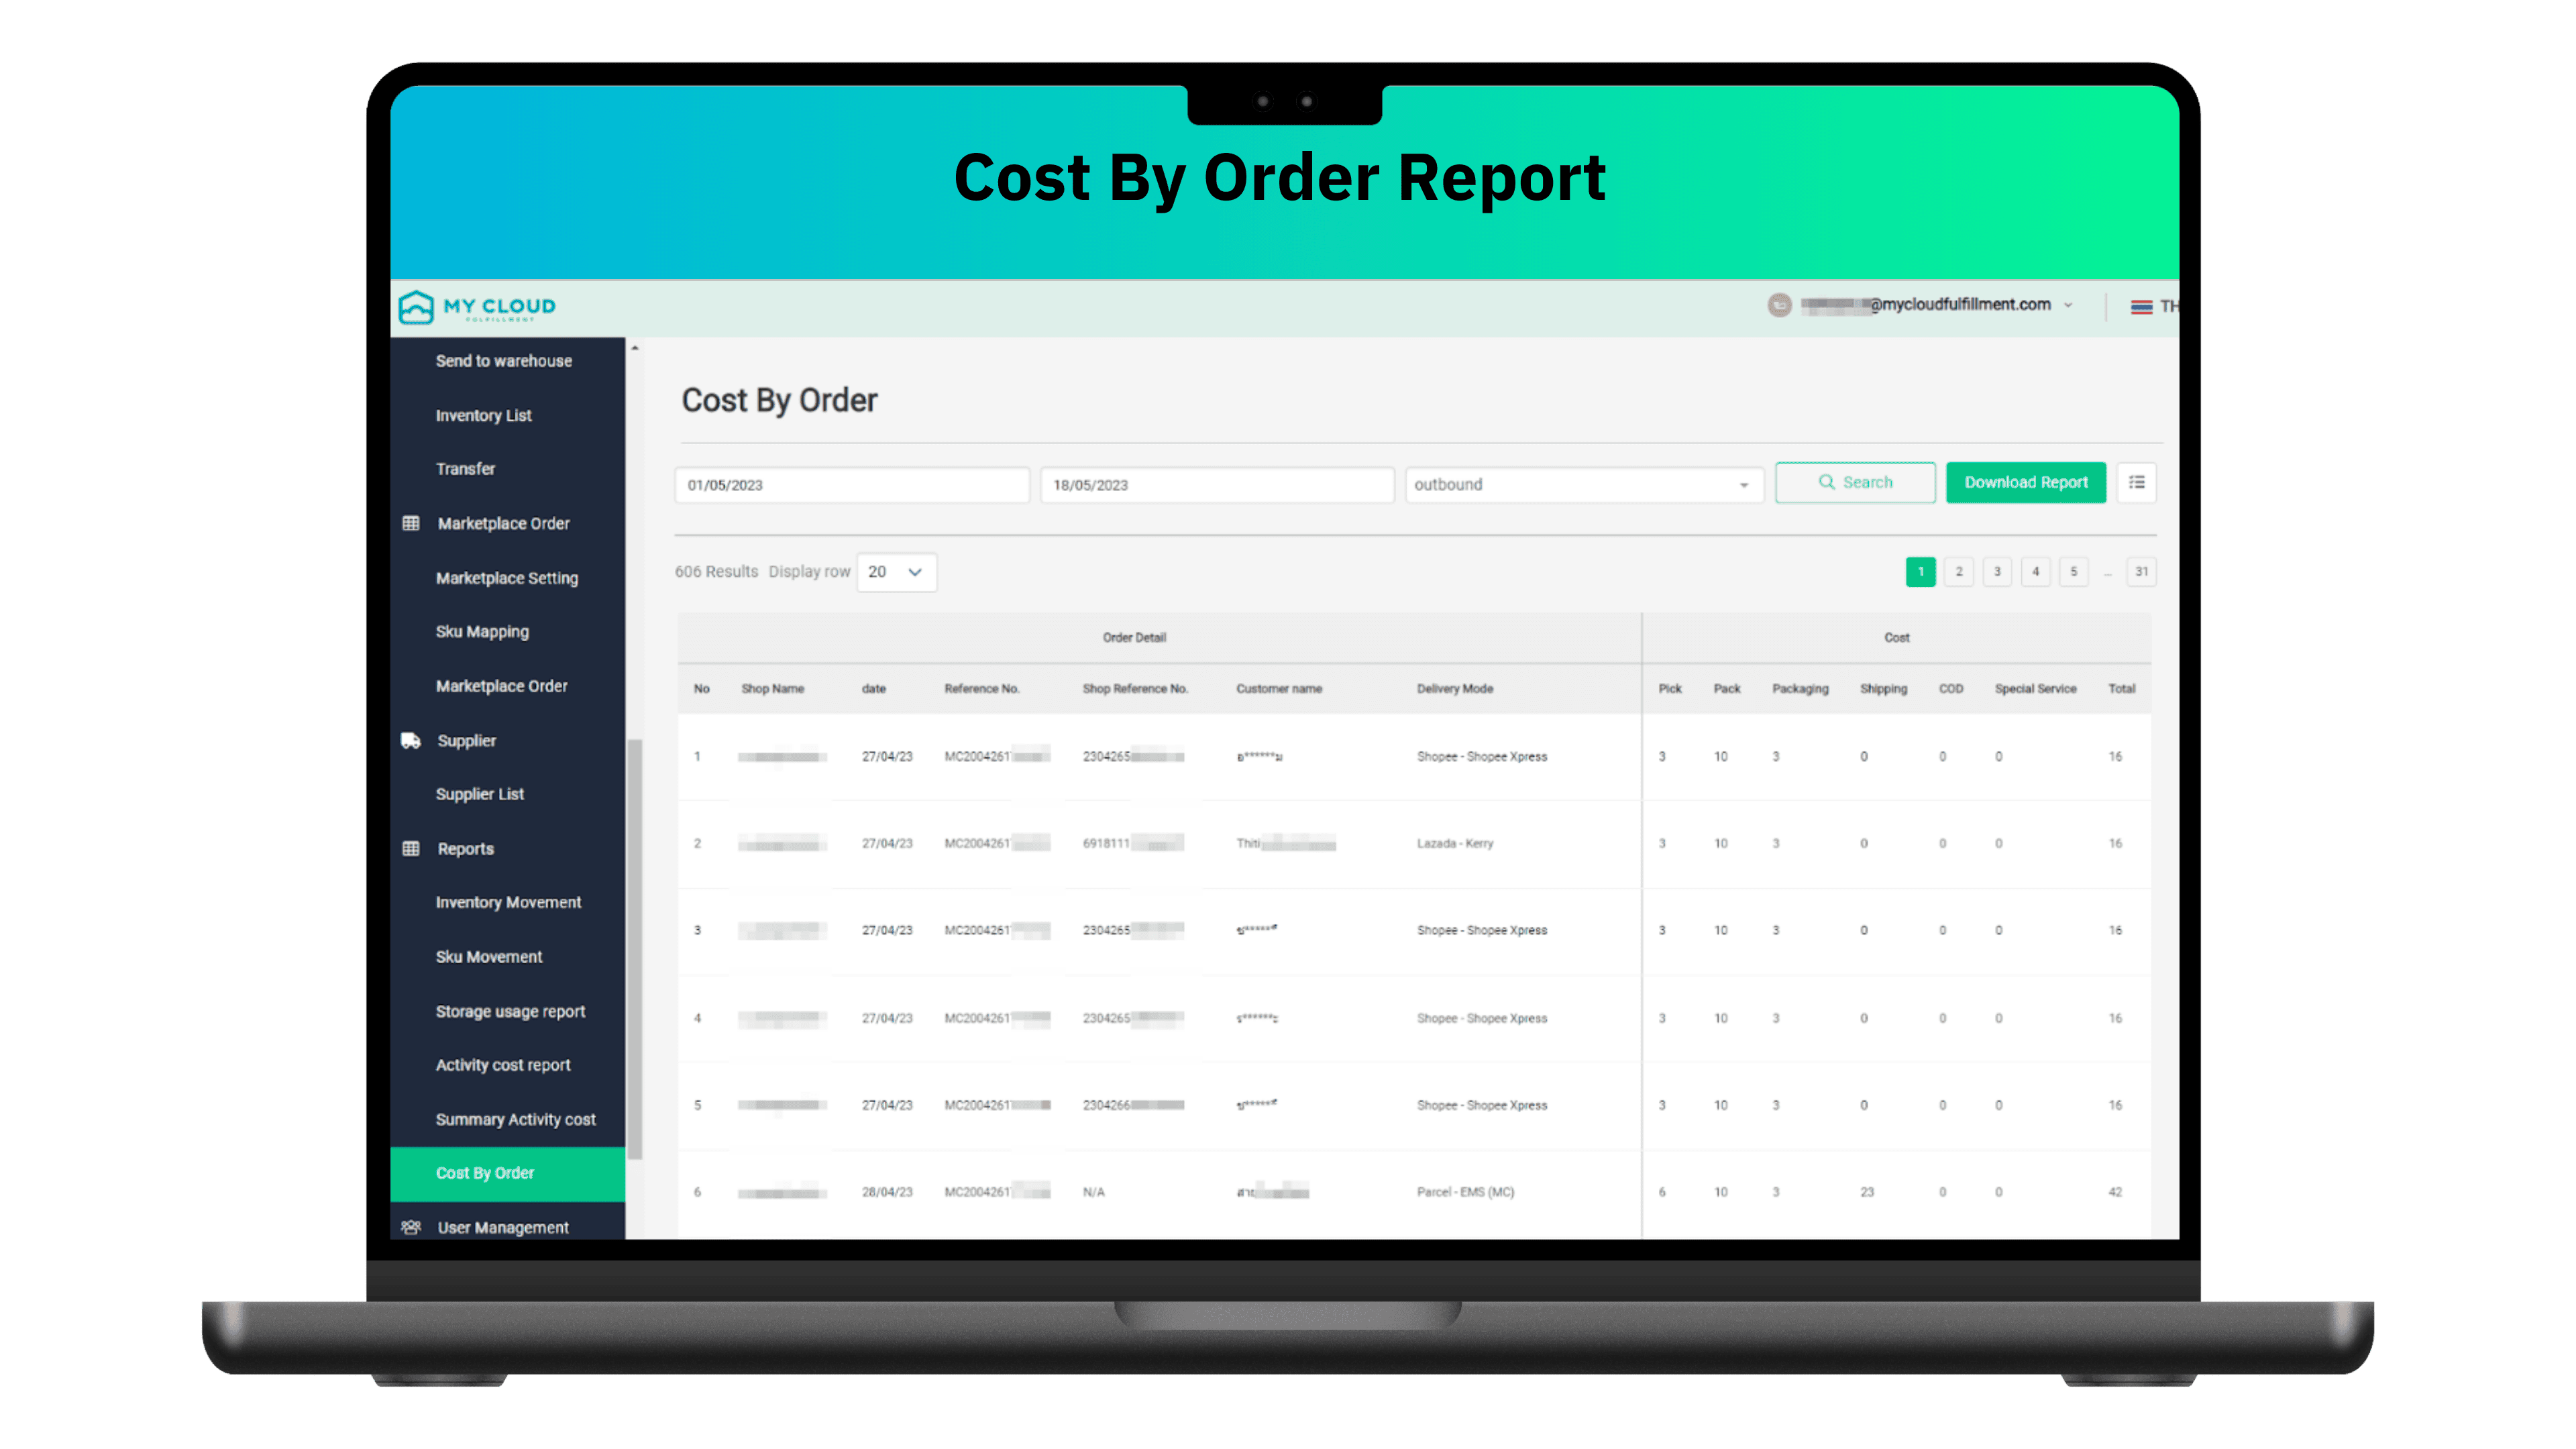
This report categorizes detailed costs per activity or order, including picking, packing materials, packing labor, shipping, and other special expenses, giving a complete view of the costs involved.

Storage Usage Reports

This report summarizes warehouse space usage, including the storage format and daily updates, allowing stores to evaluate their space utilization and plan effectively.

Summary Activity Cost Reports

This report summarizes all costs incurred during different processes, including receiving, picking, packing, etc., enabling stores to evaluate whether their expenses align with their operations.

Inventory Movement Reports  

This report provides an overview of all inventory movements, including receiving dates, additions or reductions (e.g., restocking or returns, shipments), and the latest balance.

SKU Movement Reports    

The SKU Movement Report provides detailed insights into the movement of individual SKUs, explaining reasons for additions or removals and including information on which stage of processing the product is currently at.

Activity Cost Report  

This report provides detailed expenses by activity or order, breaking down the costs of picking, packing, or other activities related to each order.

Cost By Order Reports  

This report categorizes detailed costs per activity or order, including picking, packing materials, packing labor, shipping, and other special expenses, giving a complete view of the costs involved.

Frequently Asked Questions About Reporting & Dashboards

MyCloud’s Dashboard includes:

  • Sales Dashboard: Summarizes sales by channel
  • Real-Time Fulfillment Dashboard: Current order snapshot
  • Fulfillment Dashboard: Evaluates management efficiency
  • Inventory Dashboard: Summarizes stock to boost sales opportunities

MyCloud’s reports include:

Inventory Management Reports

  • SKU Movement Report: Tracks the movement of each SKU
  • Inventory Movement Report: Overview of all inventory movements
  • Storage Usage Report: Reports on warehouse space usage

Cost Management Reports

  • Cost By Order Report: Breaks down costs per order
  • Summary Activity Cost Report: Summarizes costs by activity
  • Activity Cost Report: Provides detailed activity-based costs for each order

Reports & Dashboards form part of the sales summary for each channel. Reports help you manage your sales more efficiently, while Dashboards help manage products and stock effectively. This helps reduce costs, increase sales, and improve overall store performance.